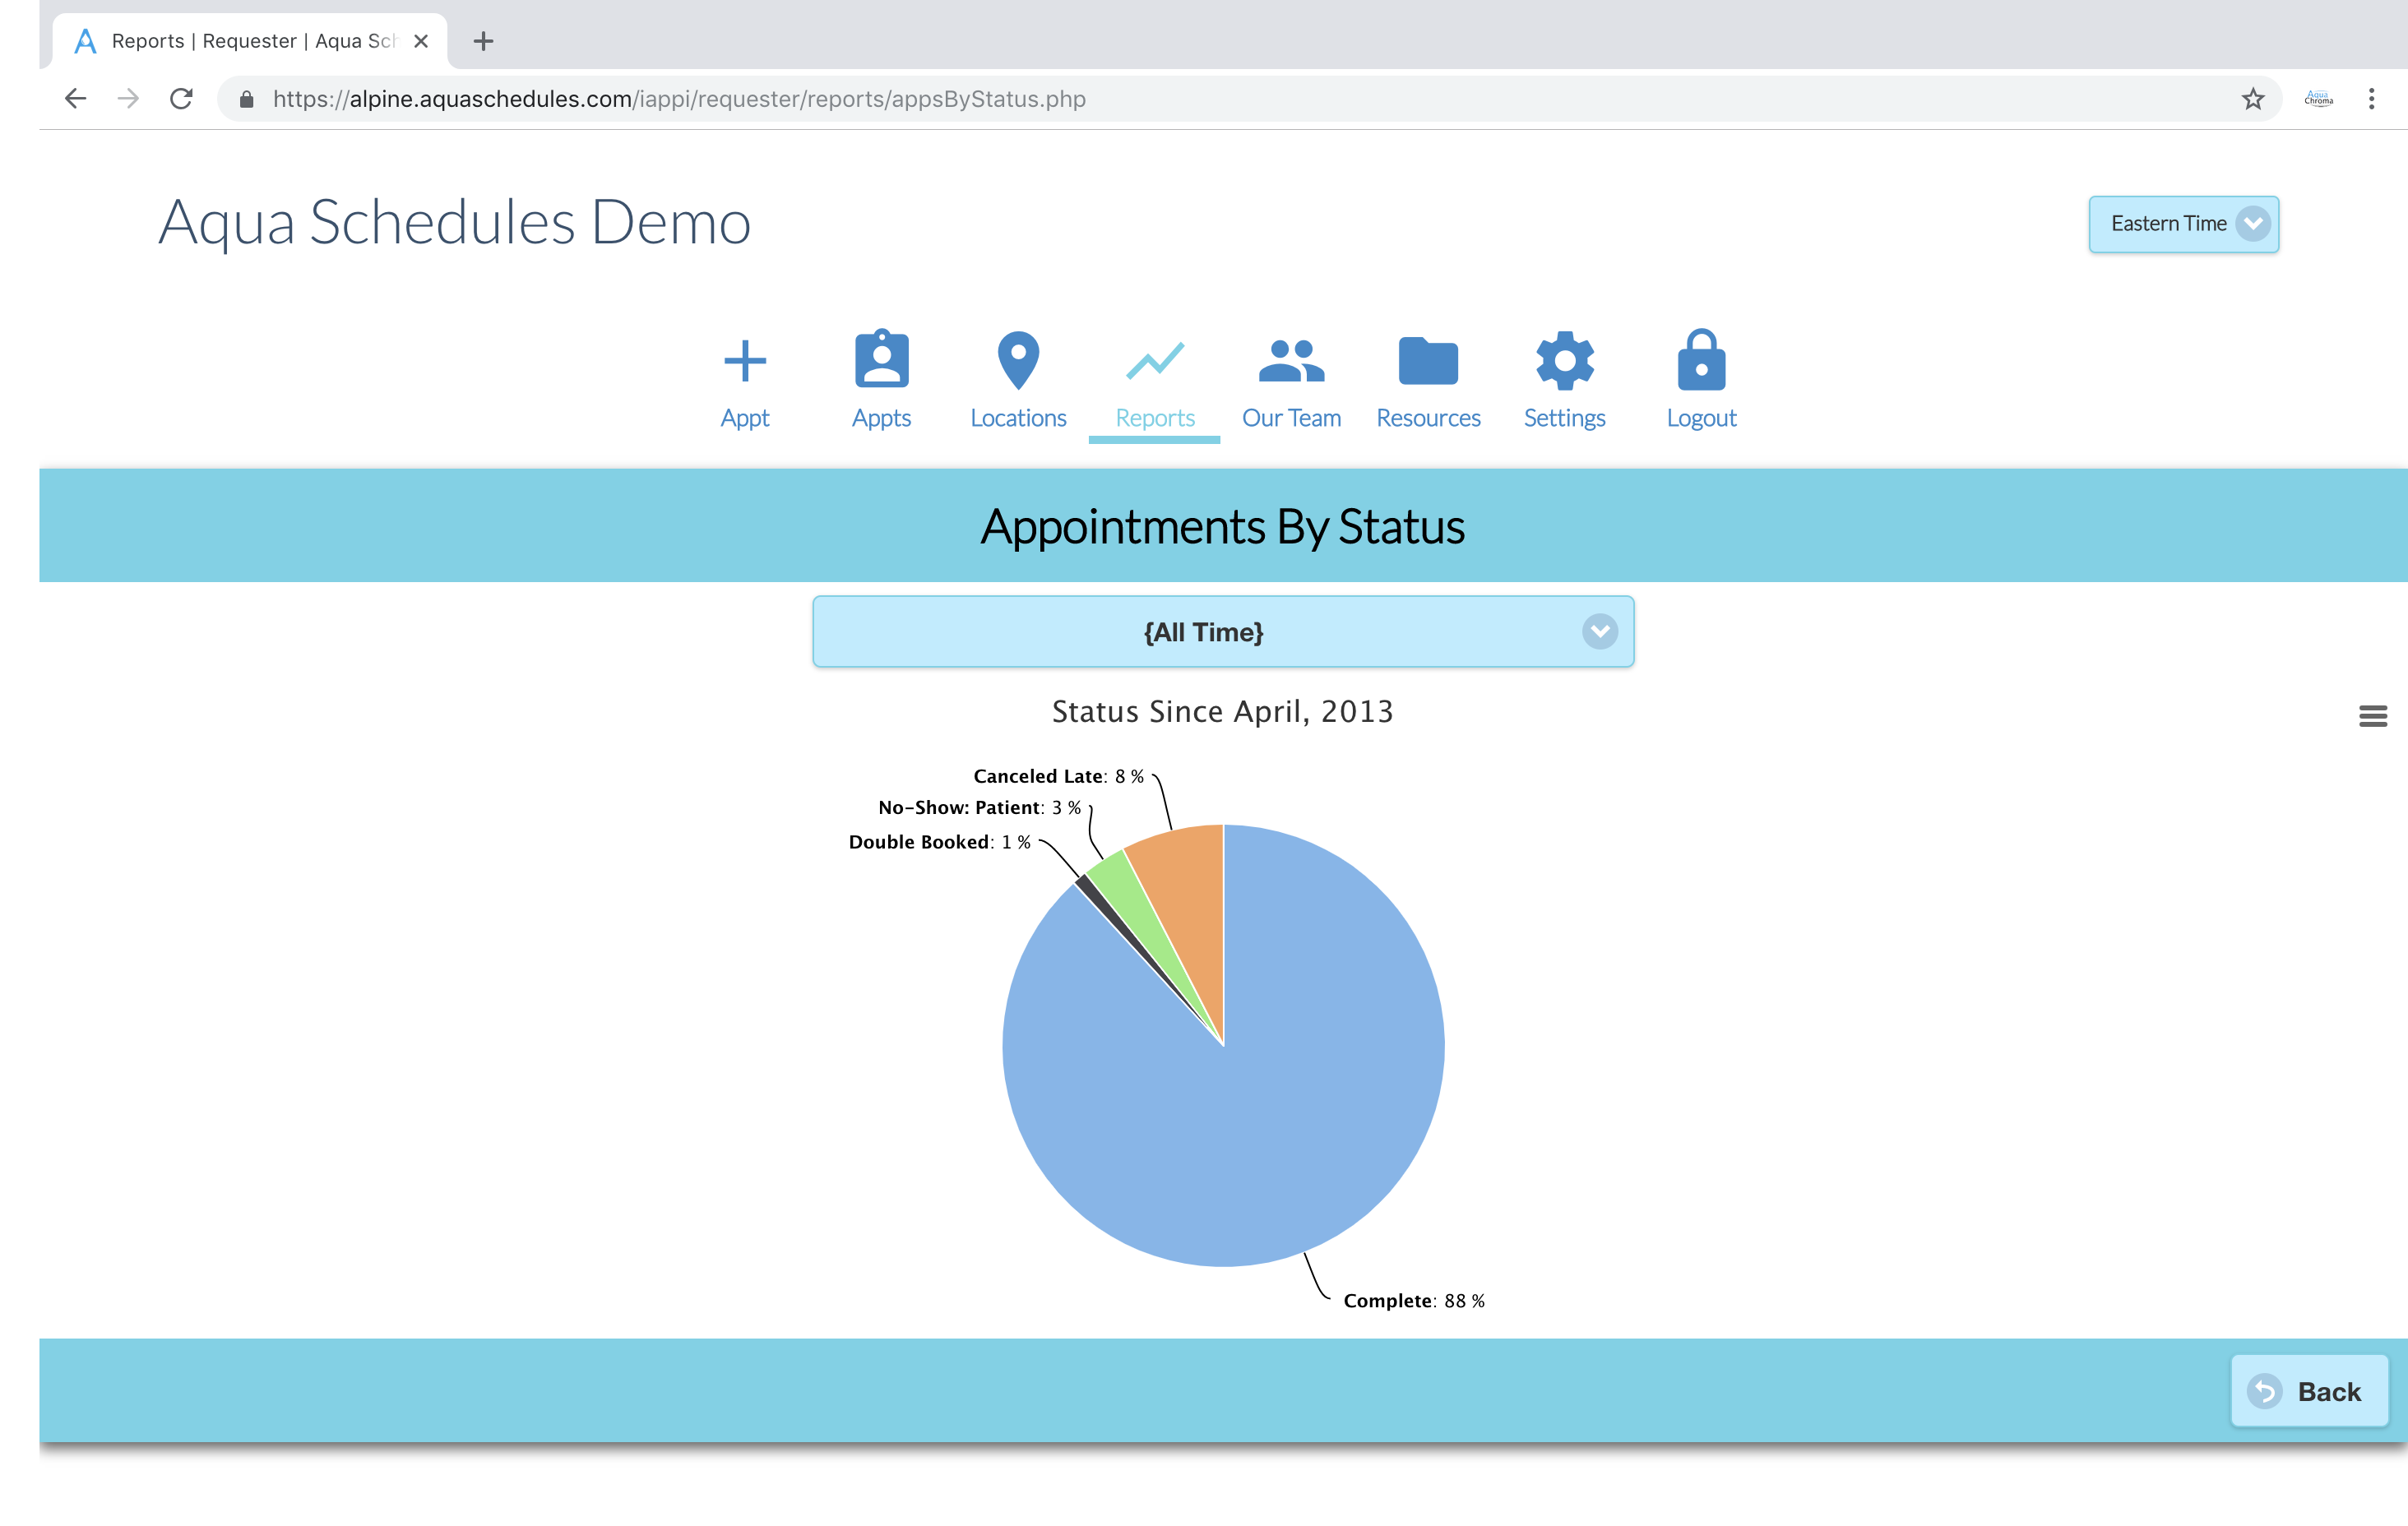
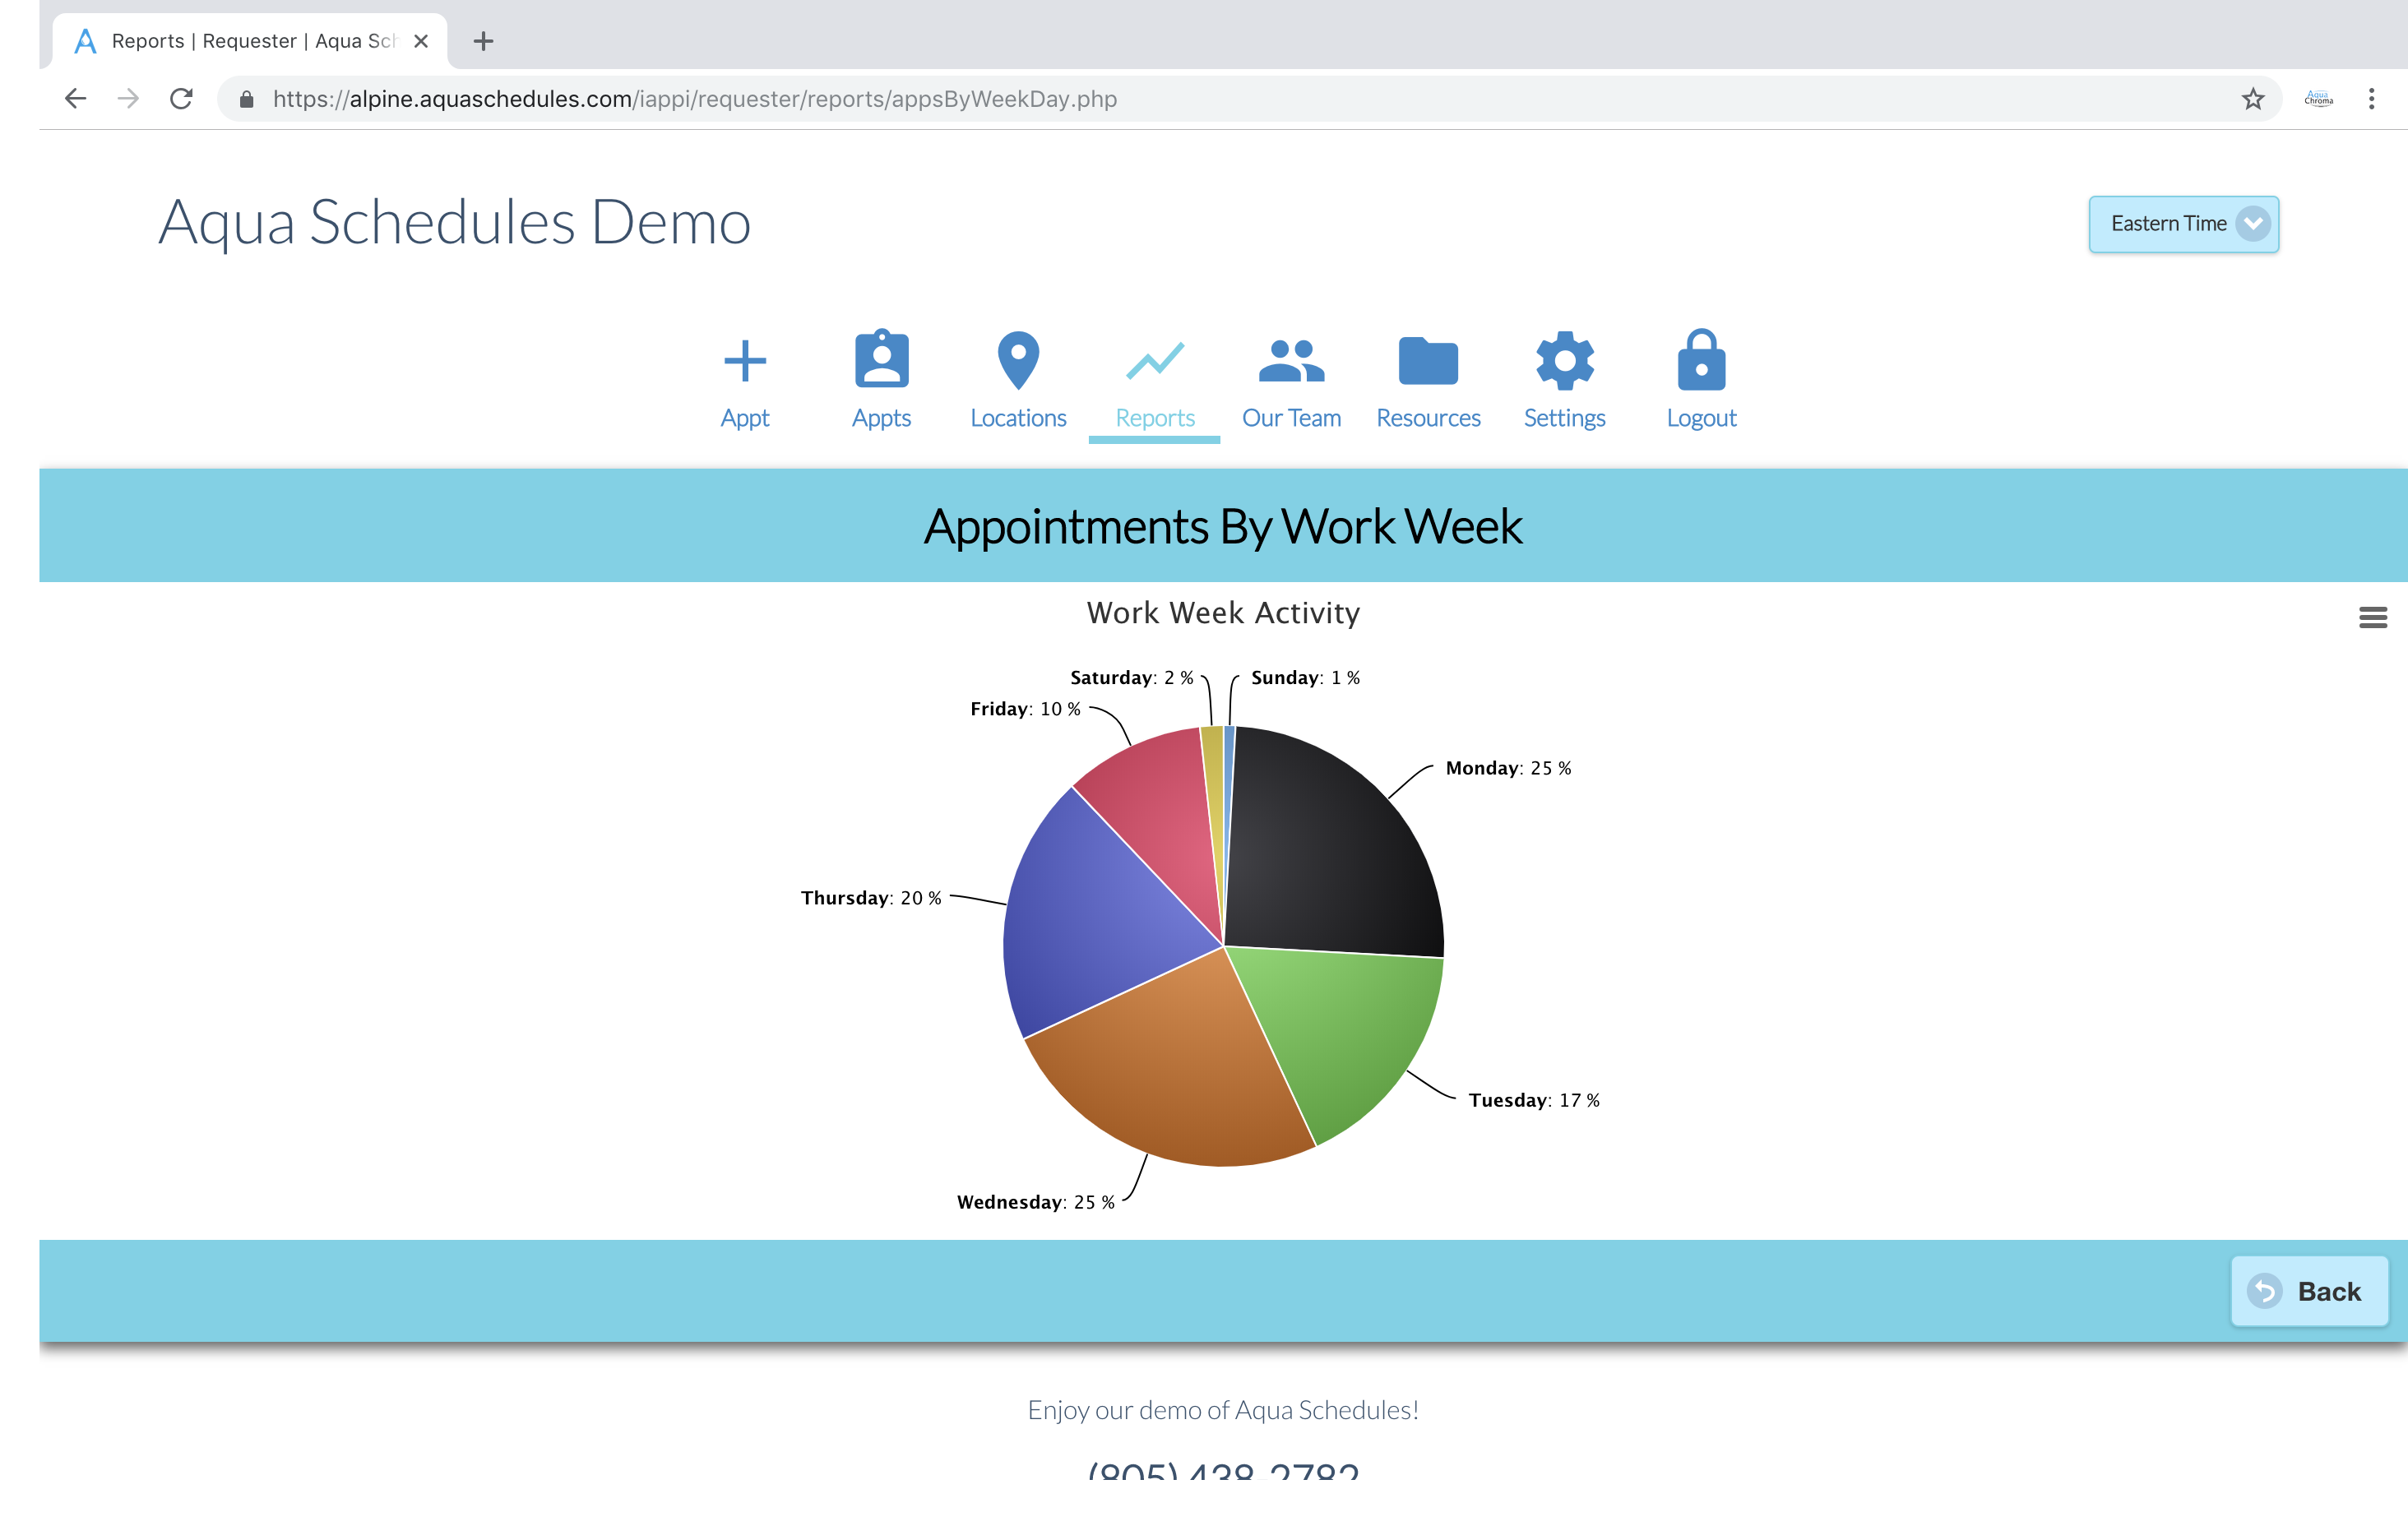
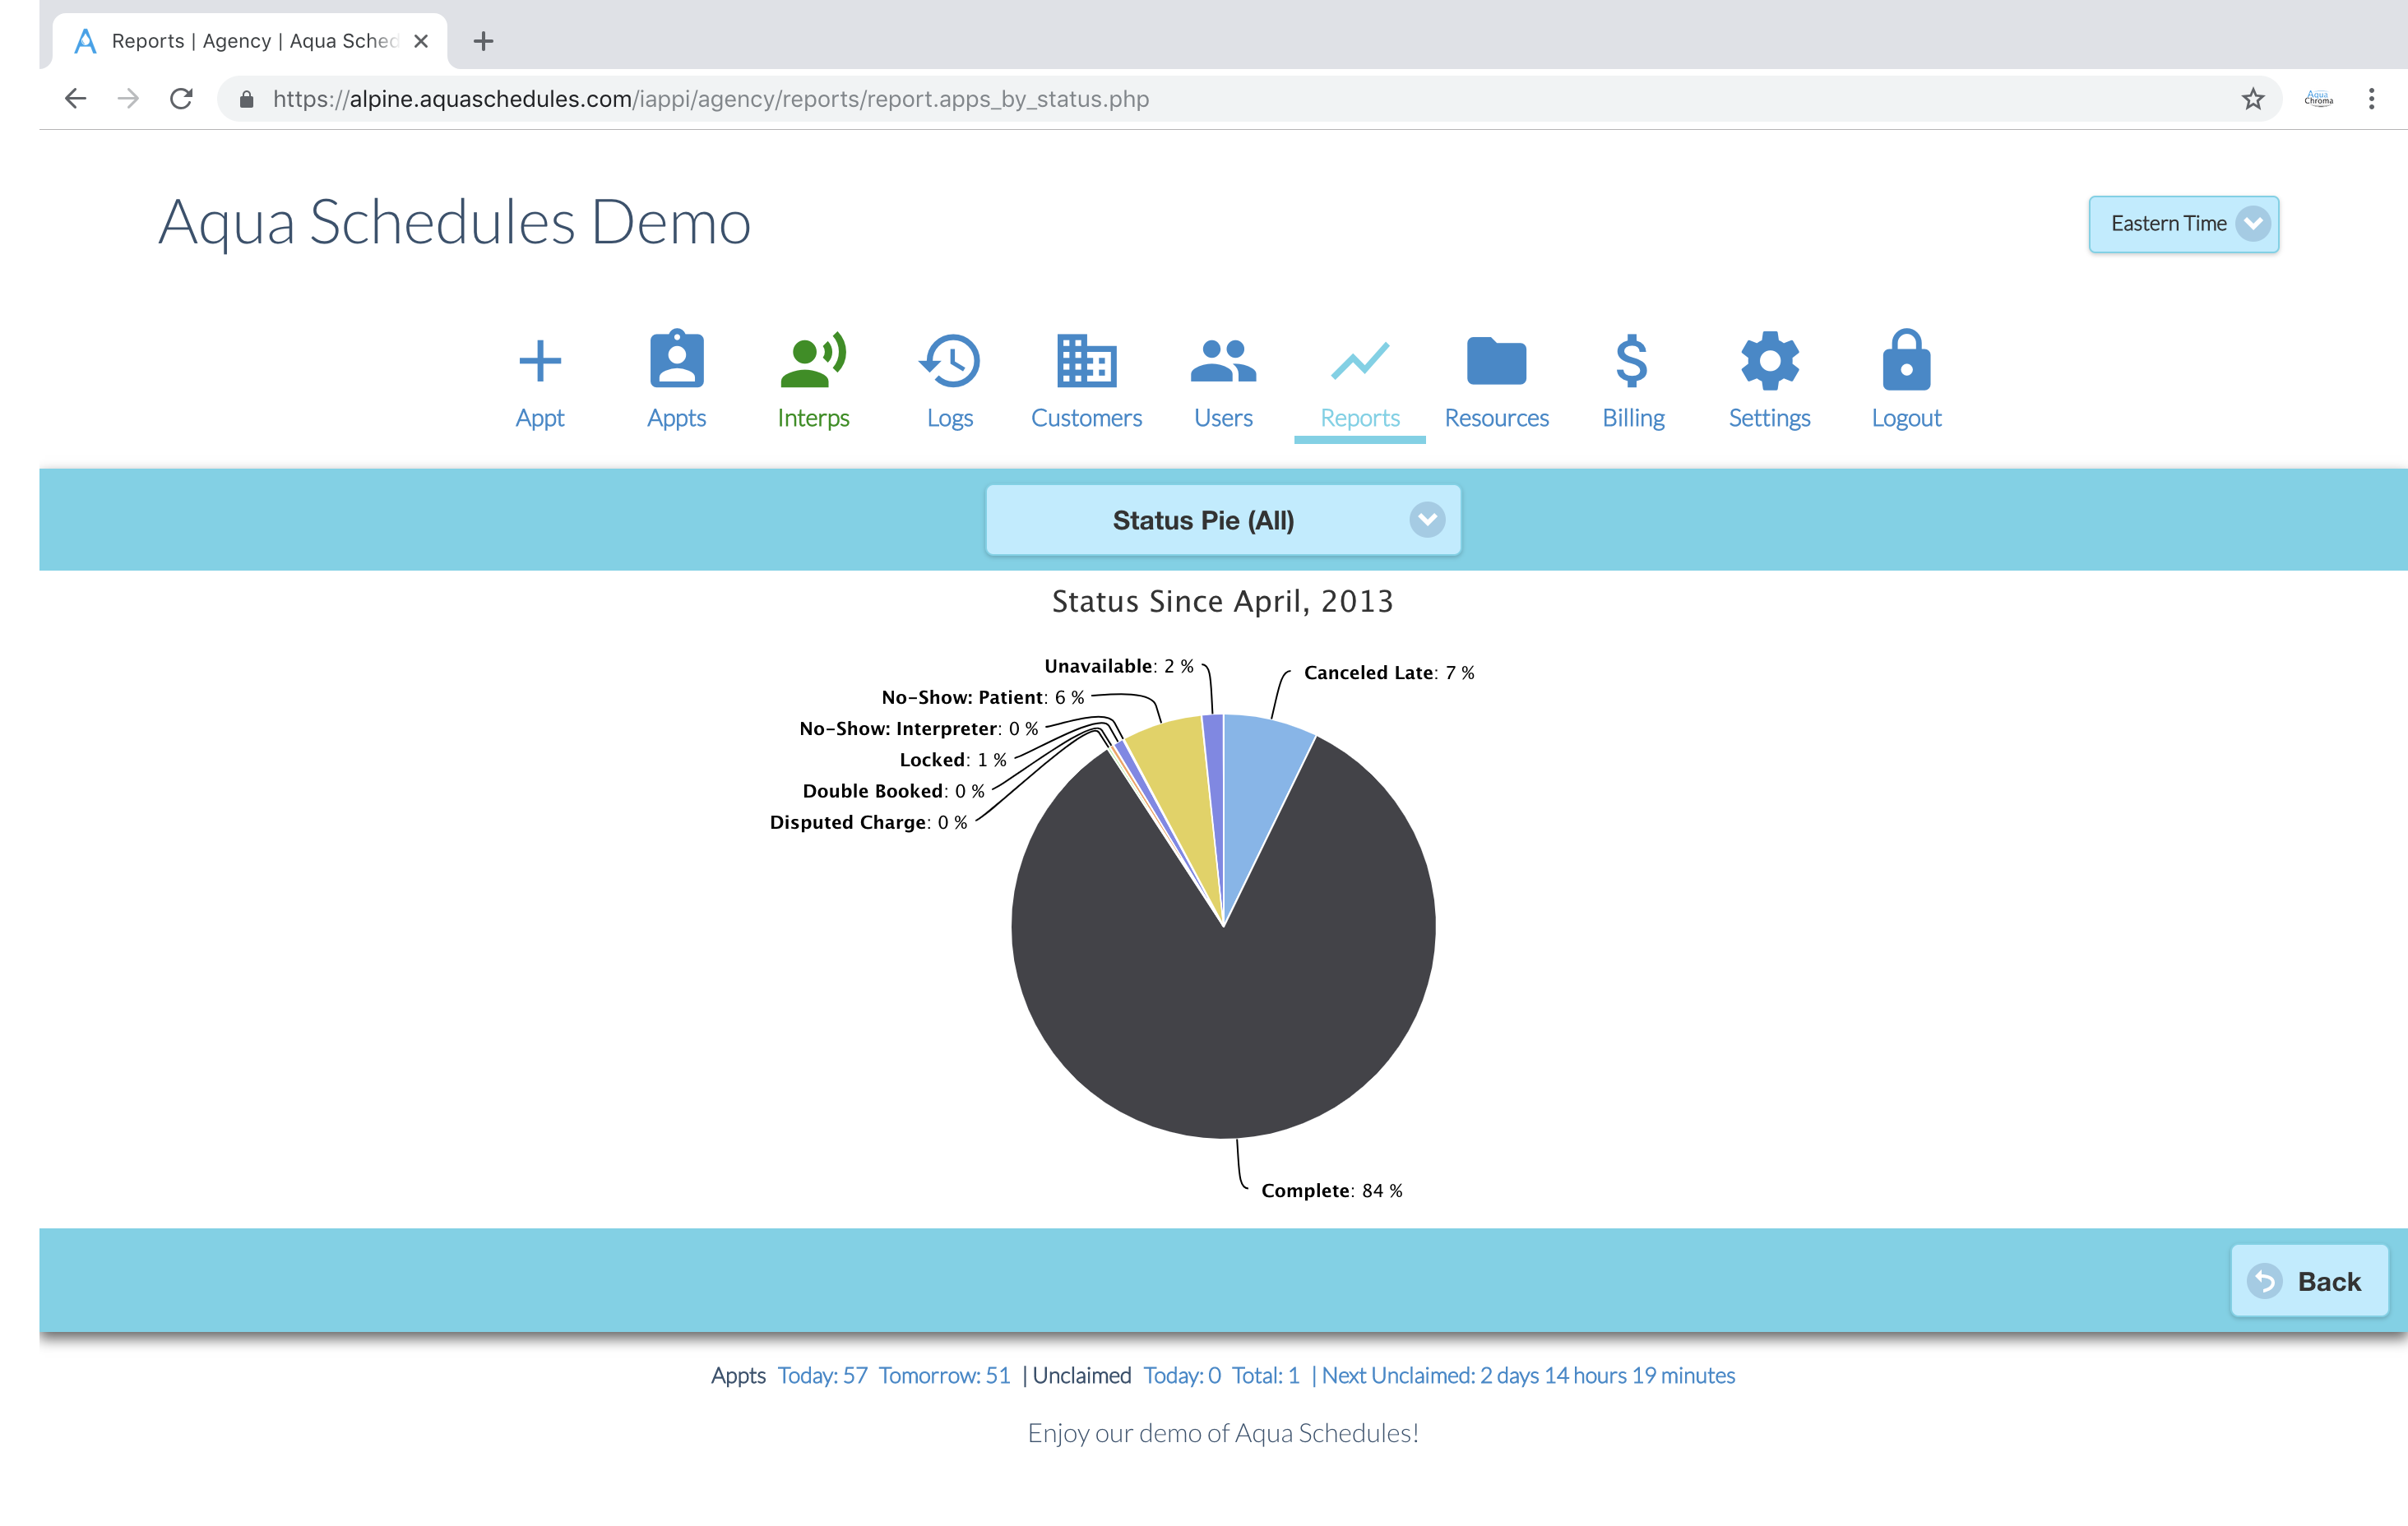
Status Pie
See an overview of the percentage of appointments by status.
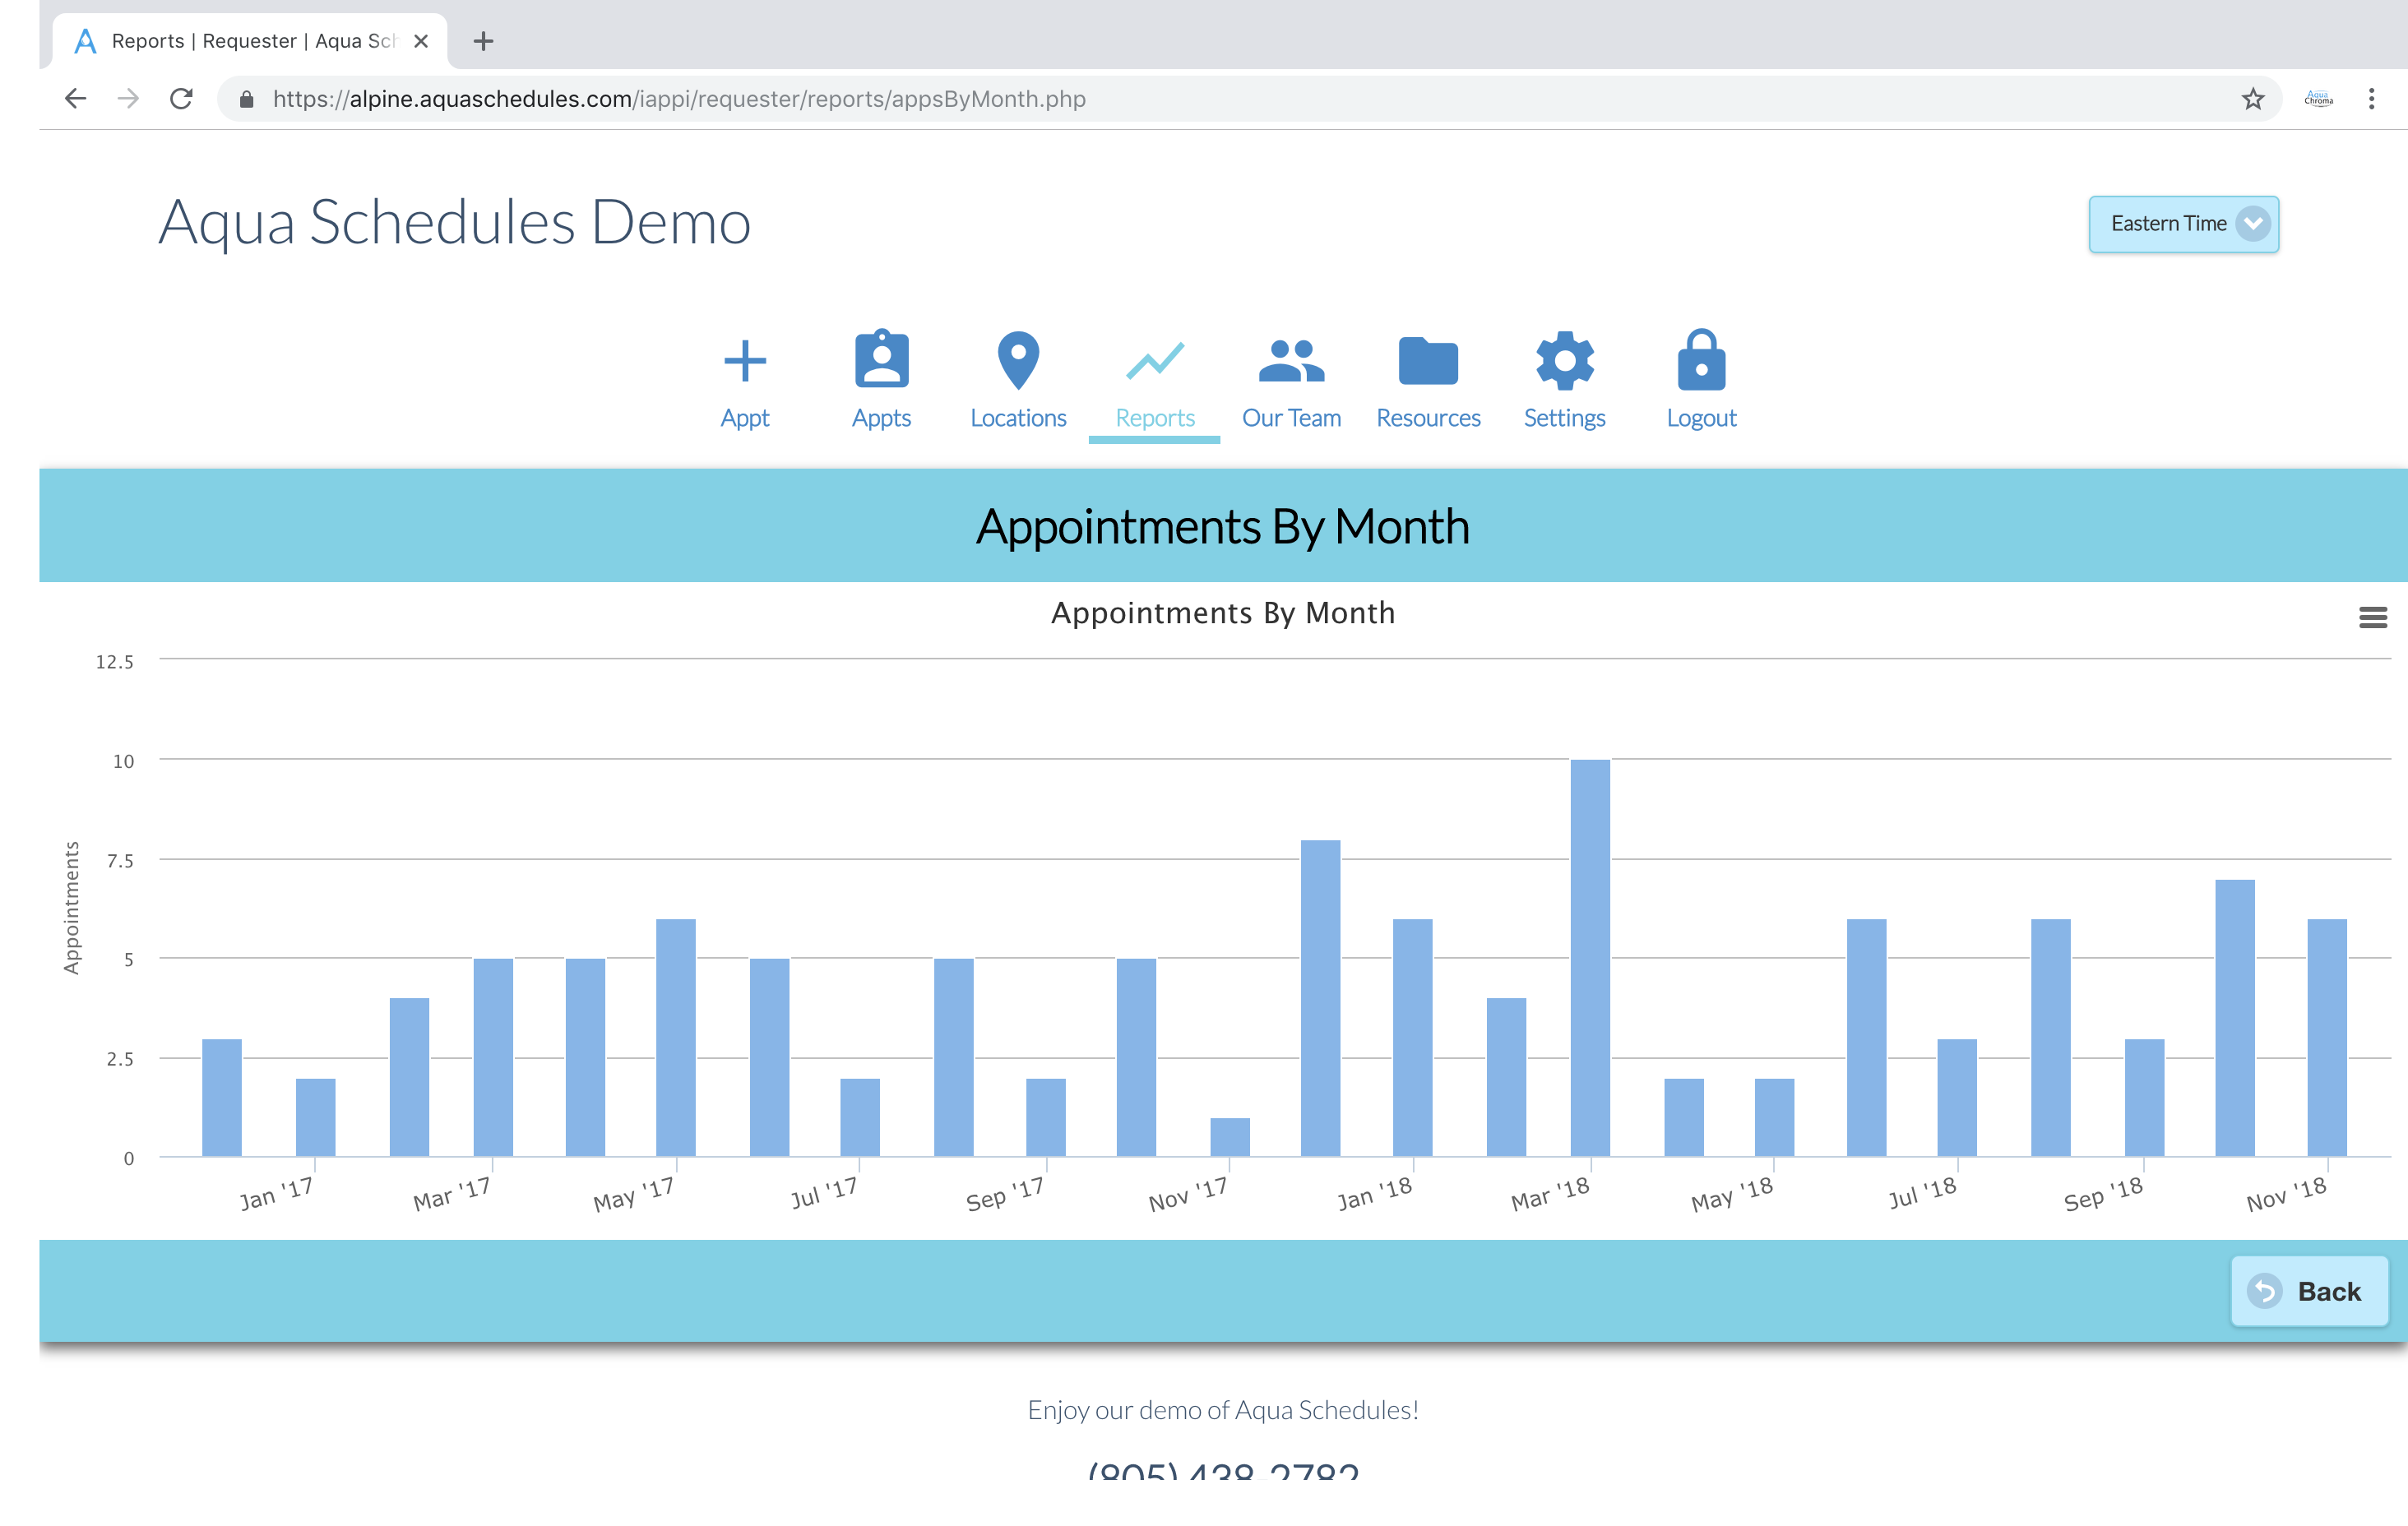
Line graph of the number of appointments created by each role.
Read More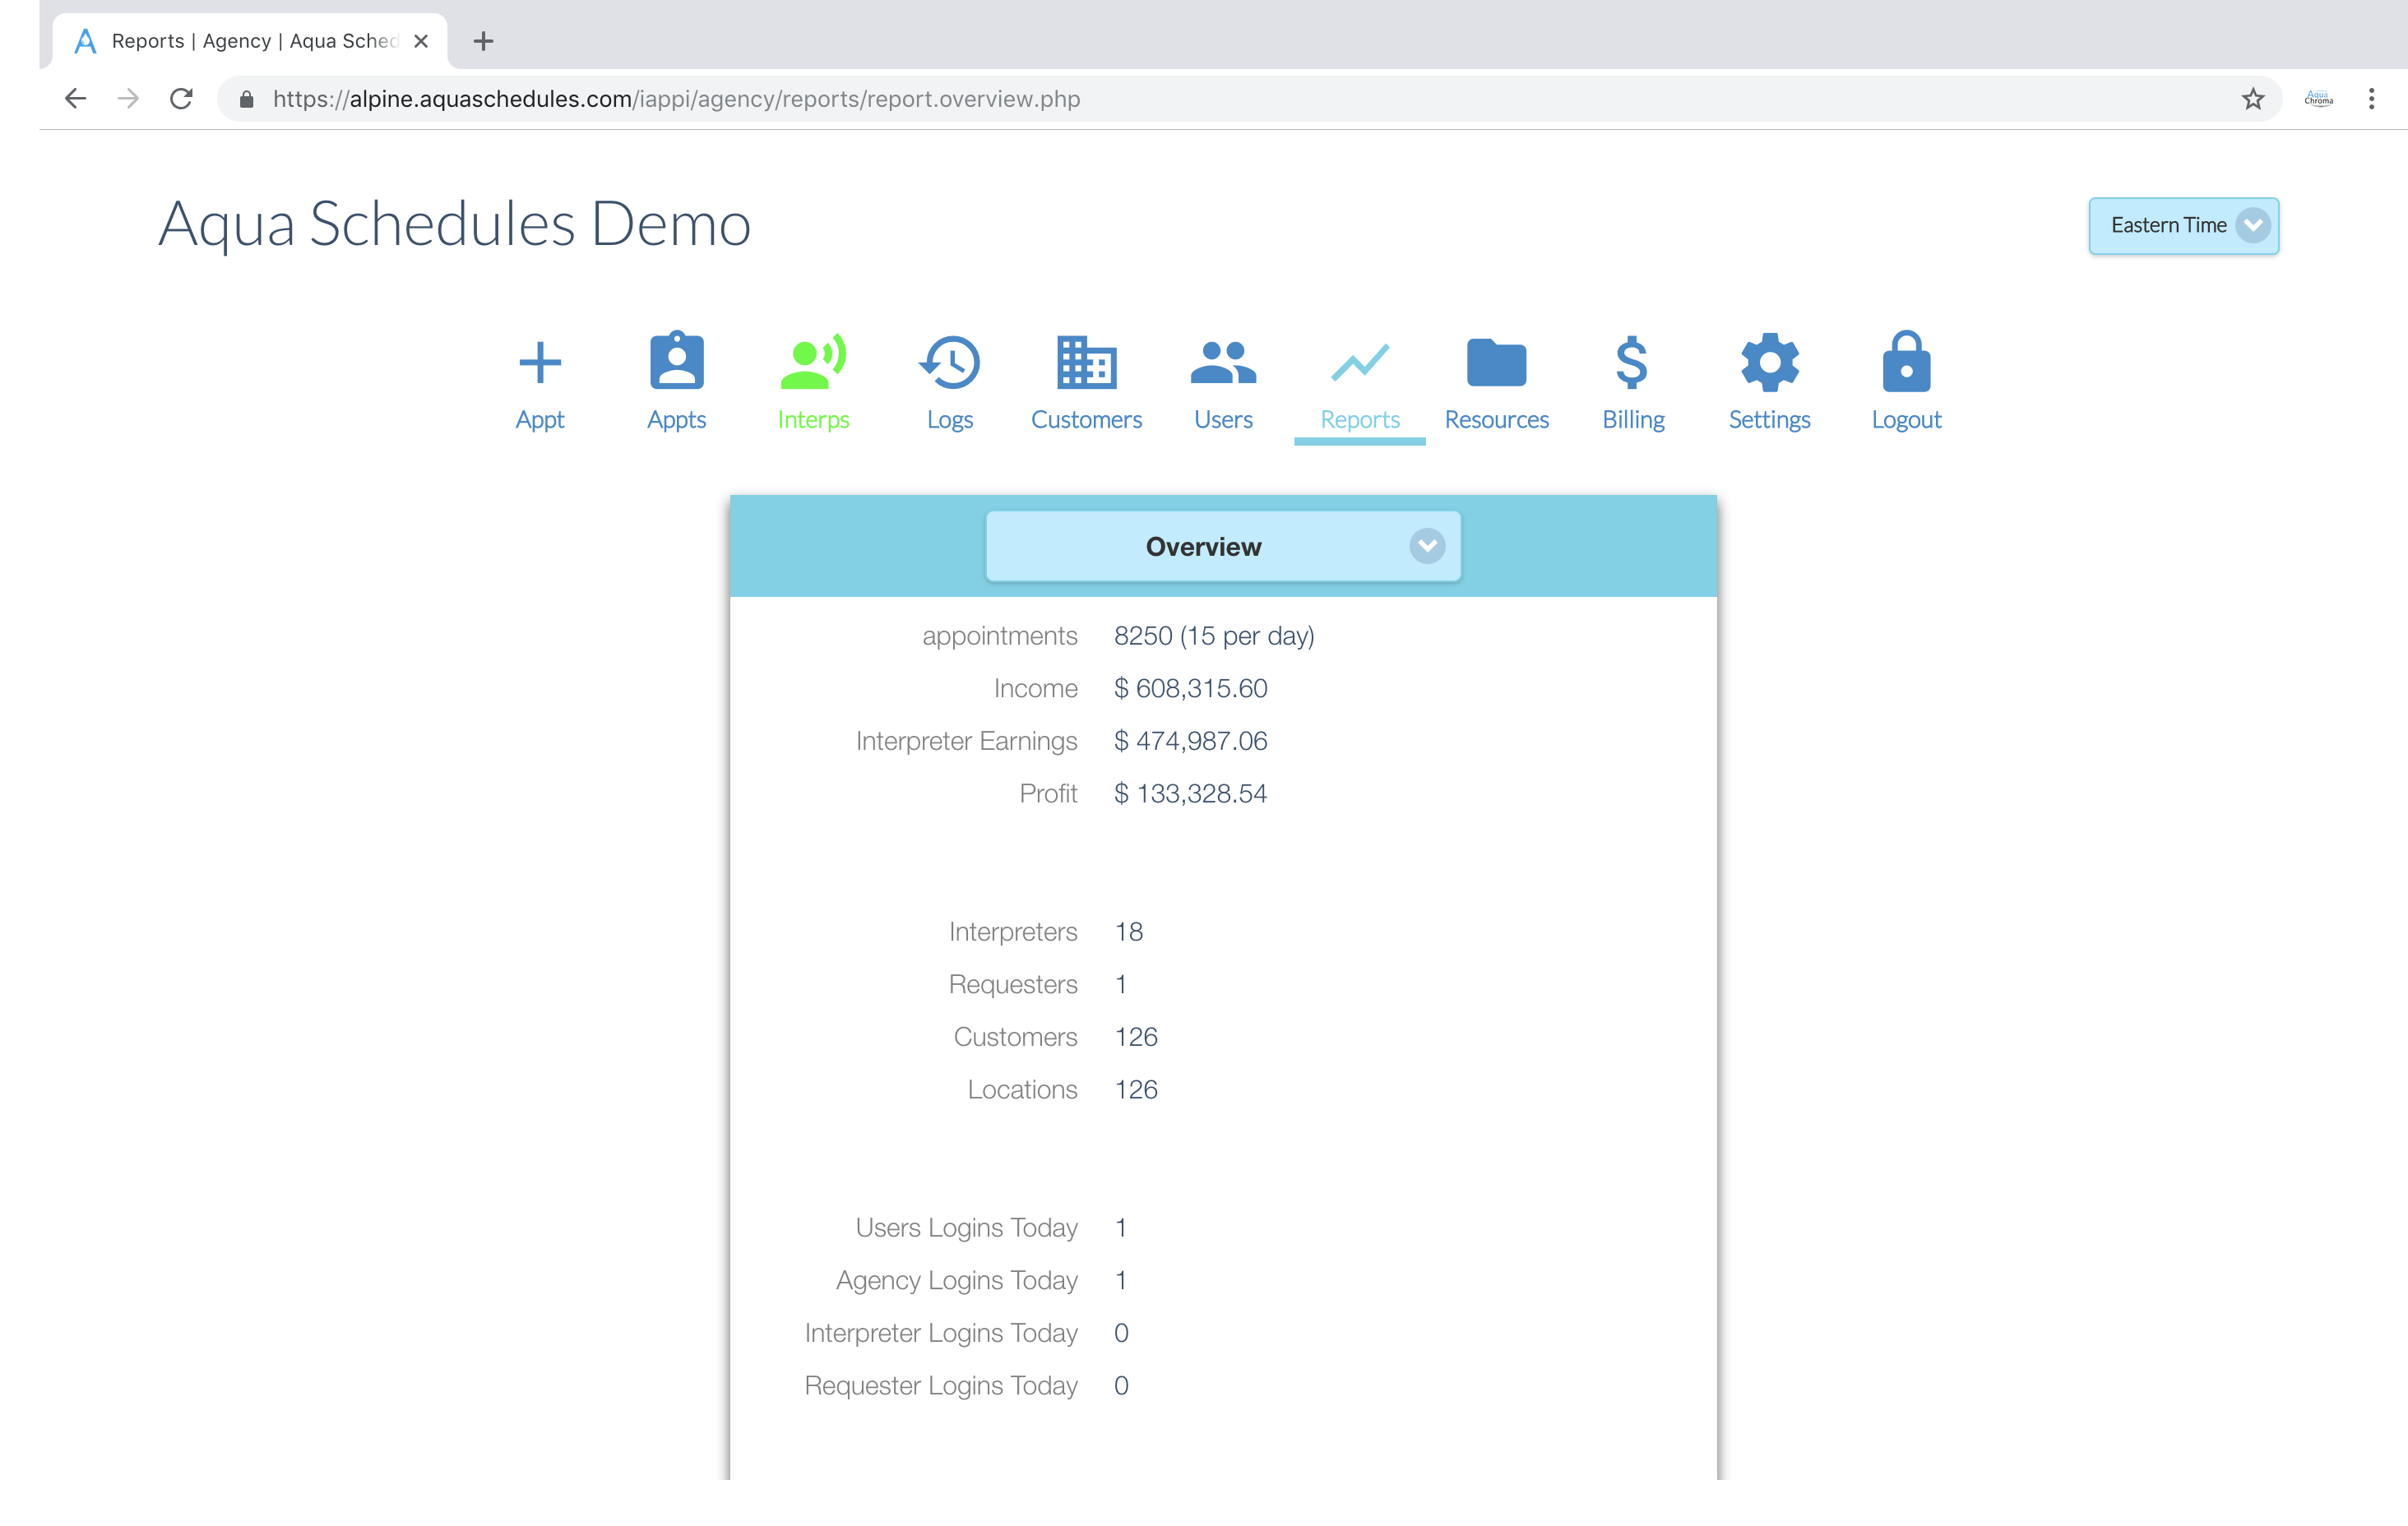
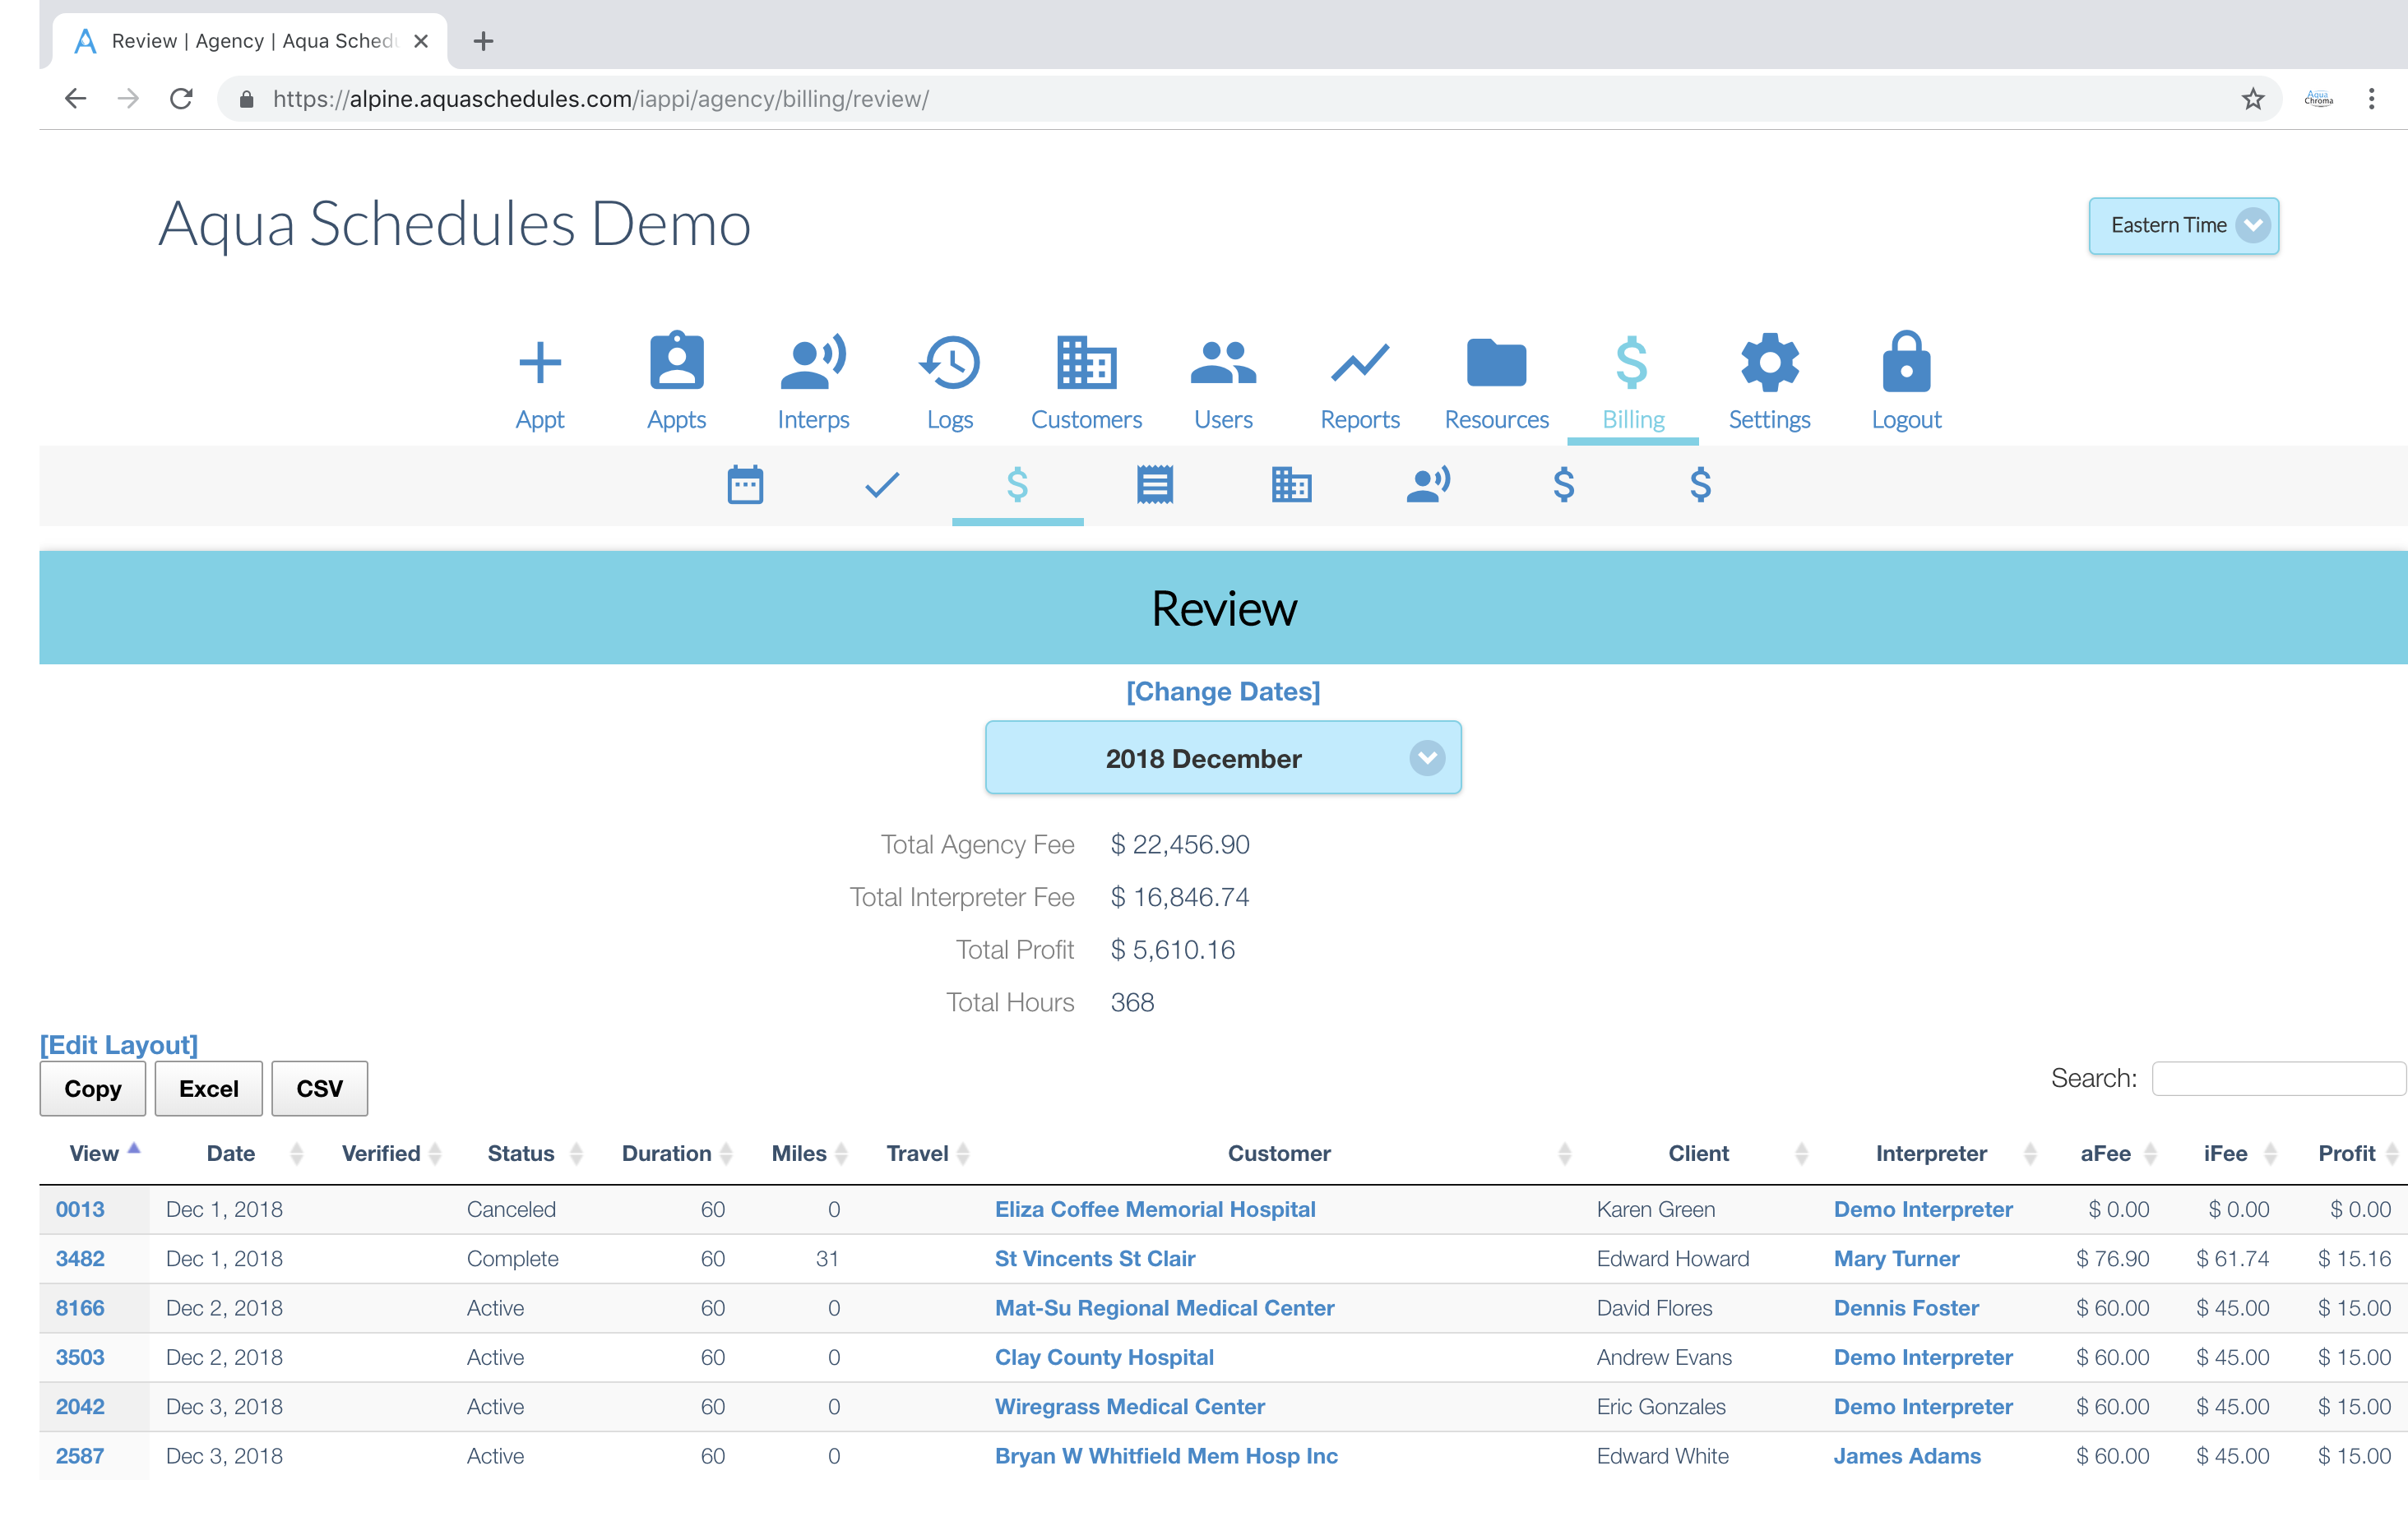
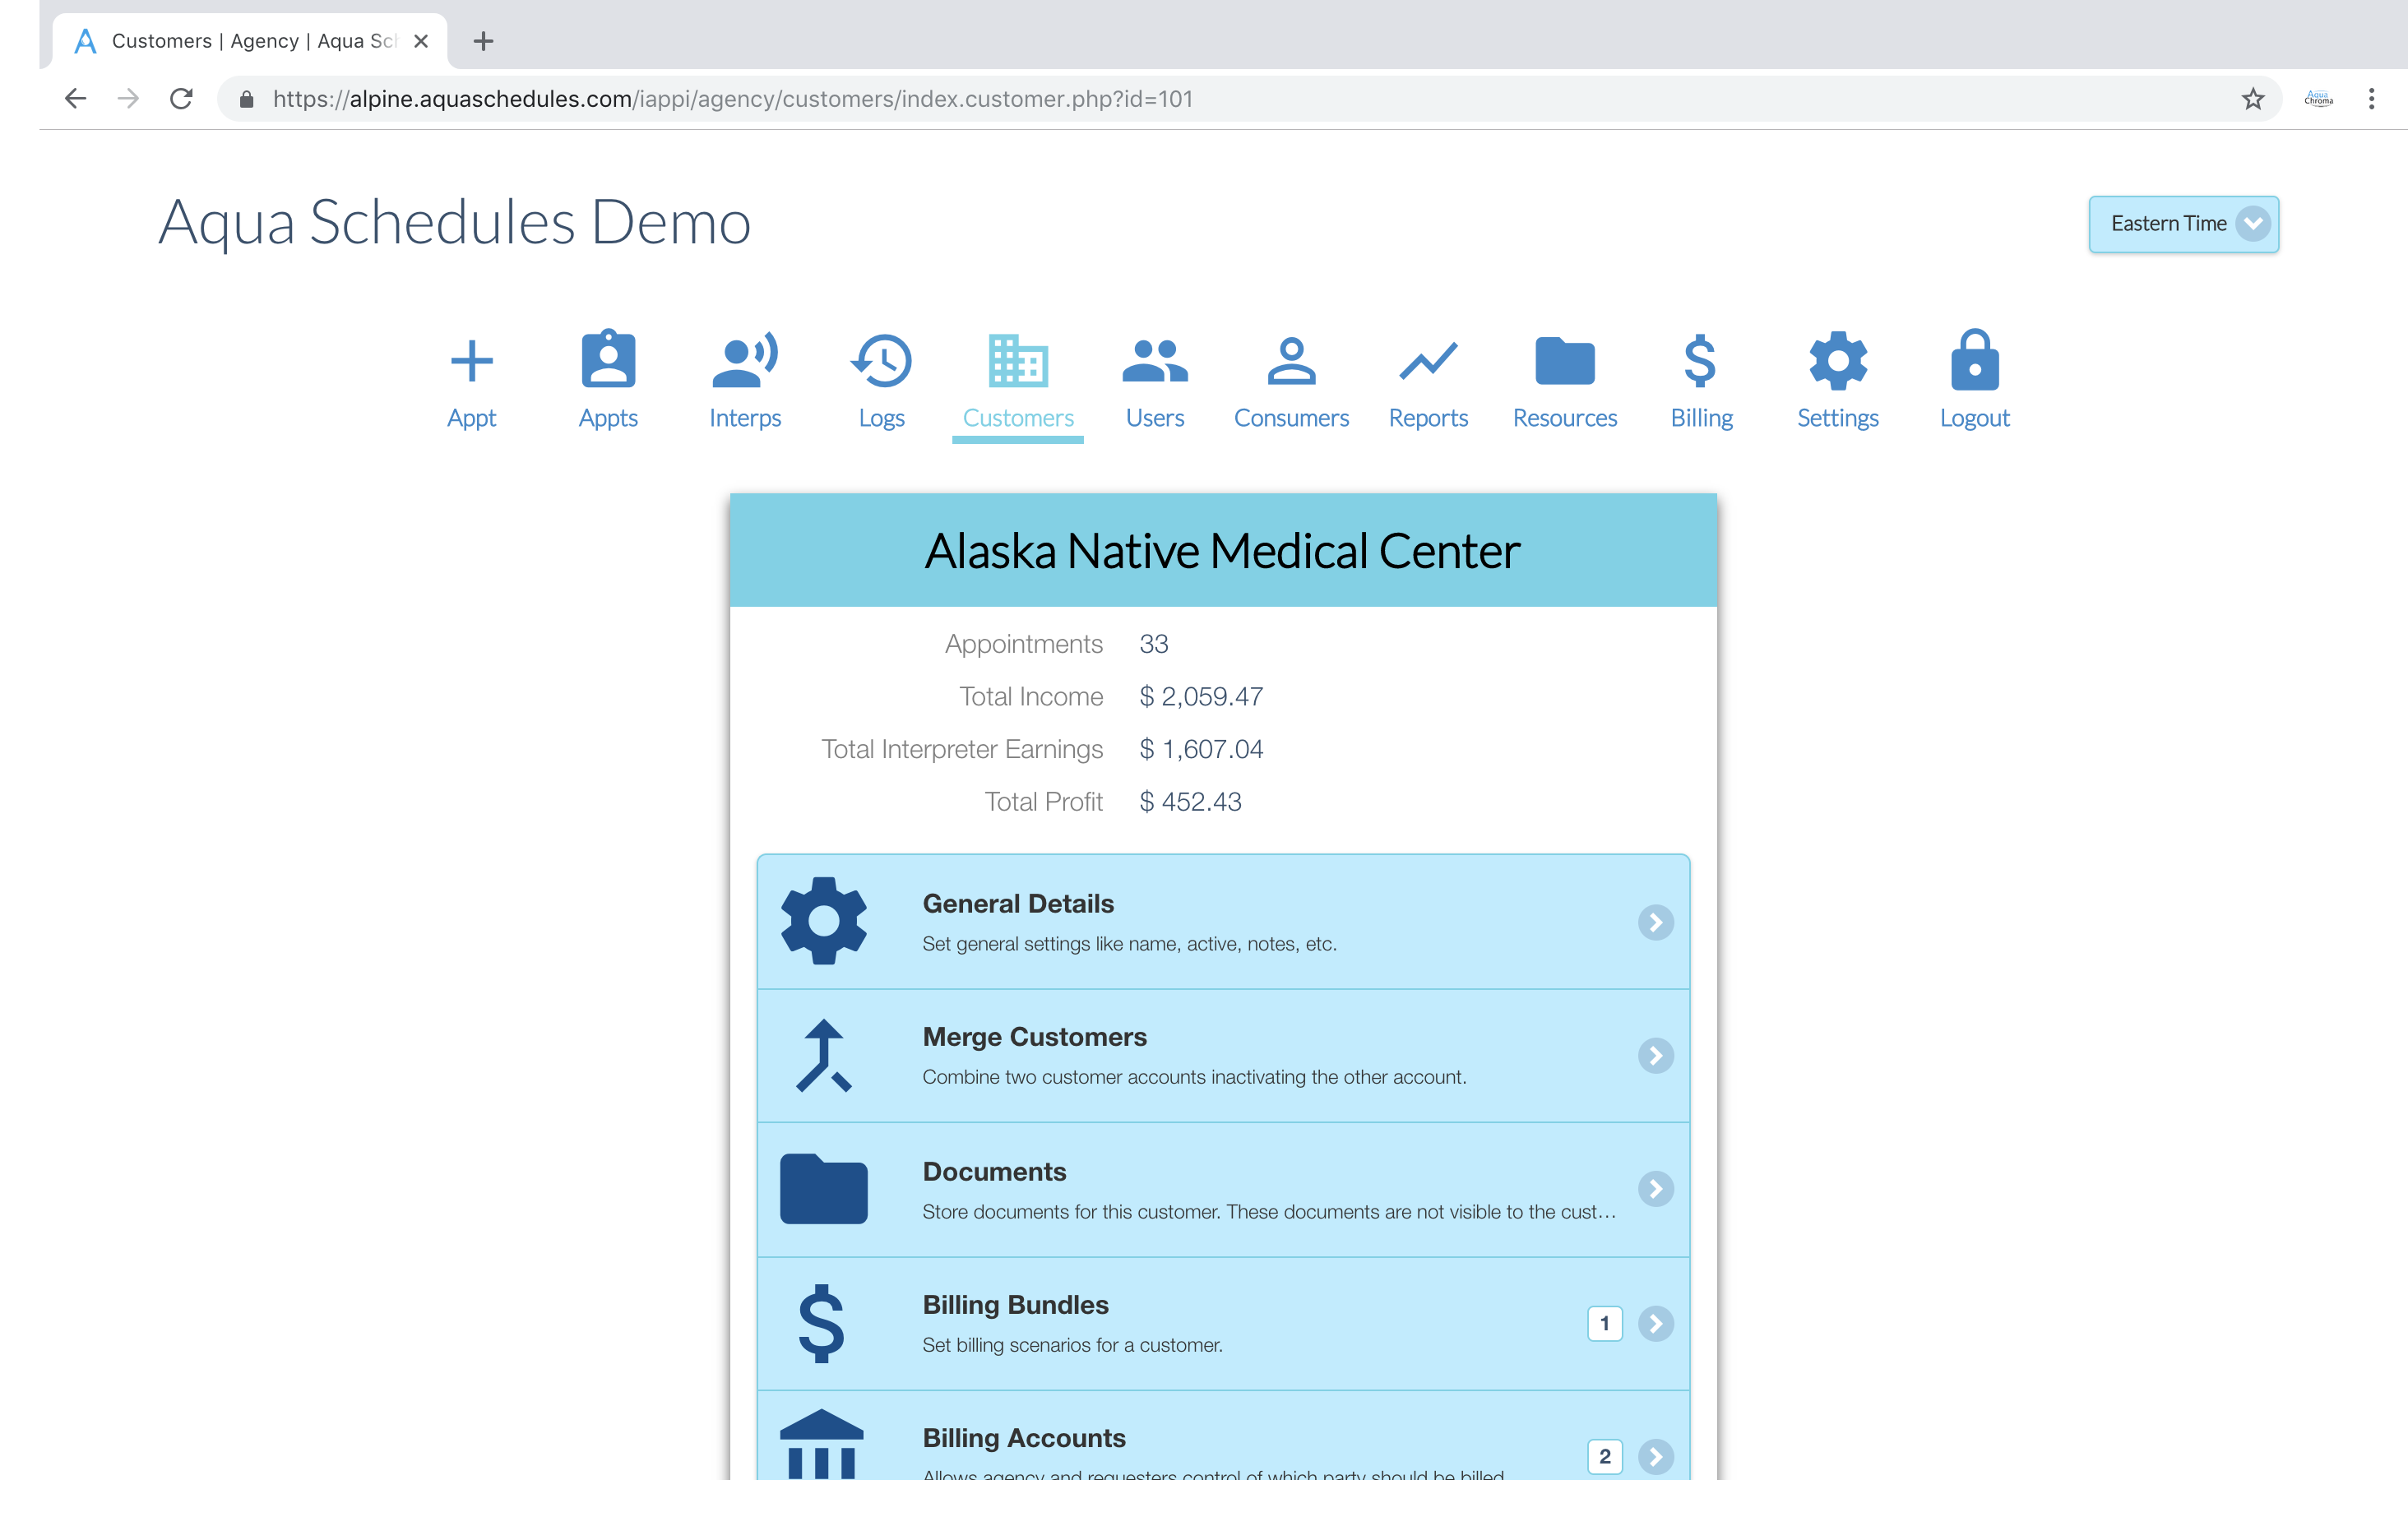
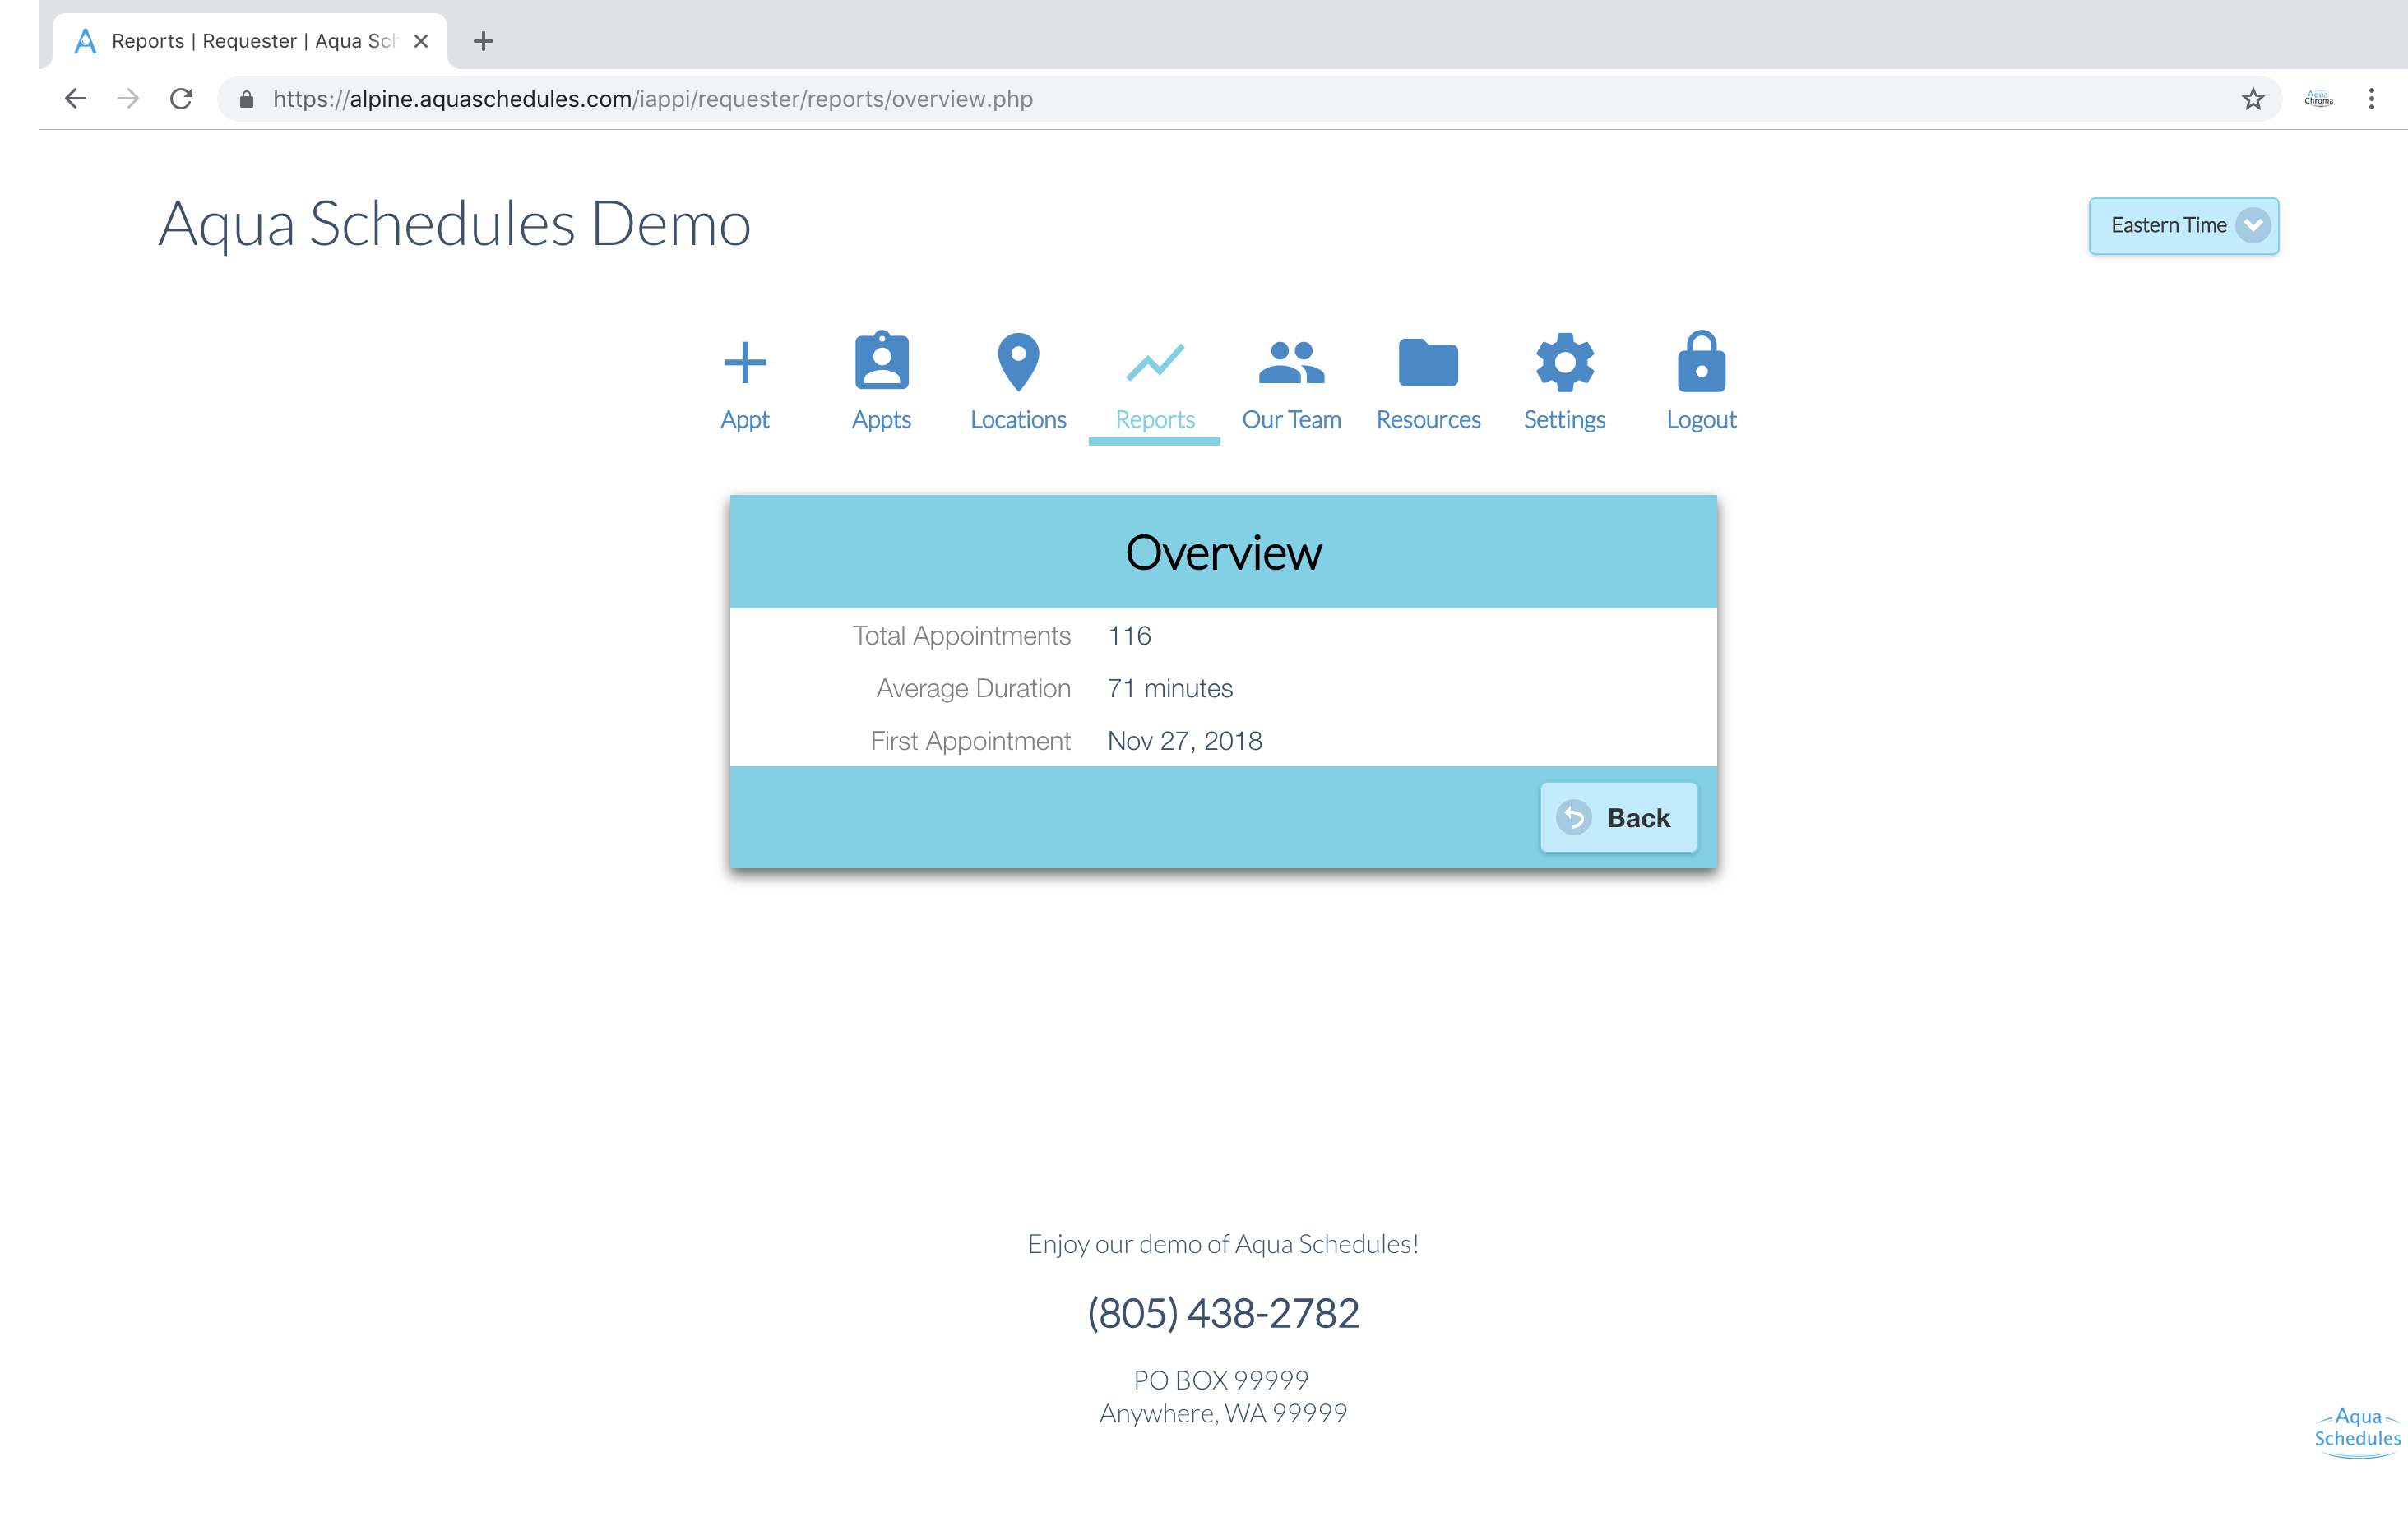
Summary of total appointments, income, expenses, profits, user types, locations, accounts, and pages tracked.
Read More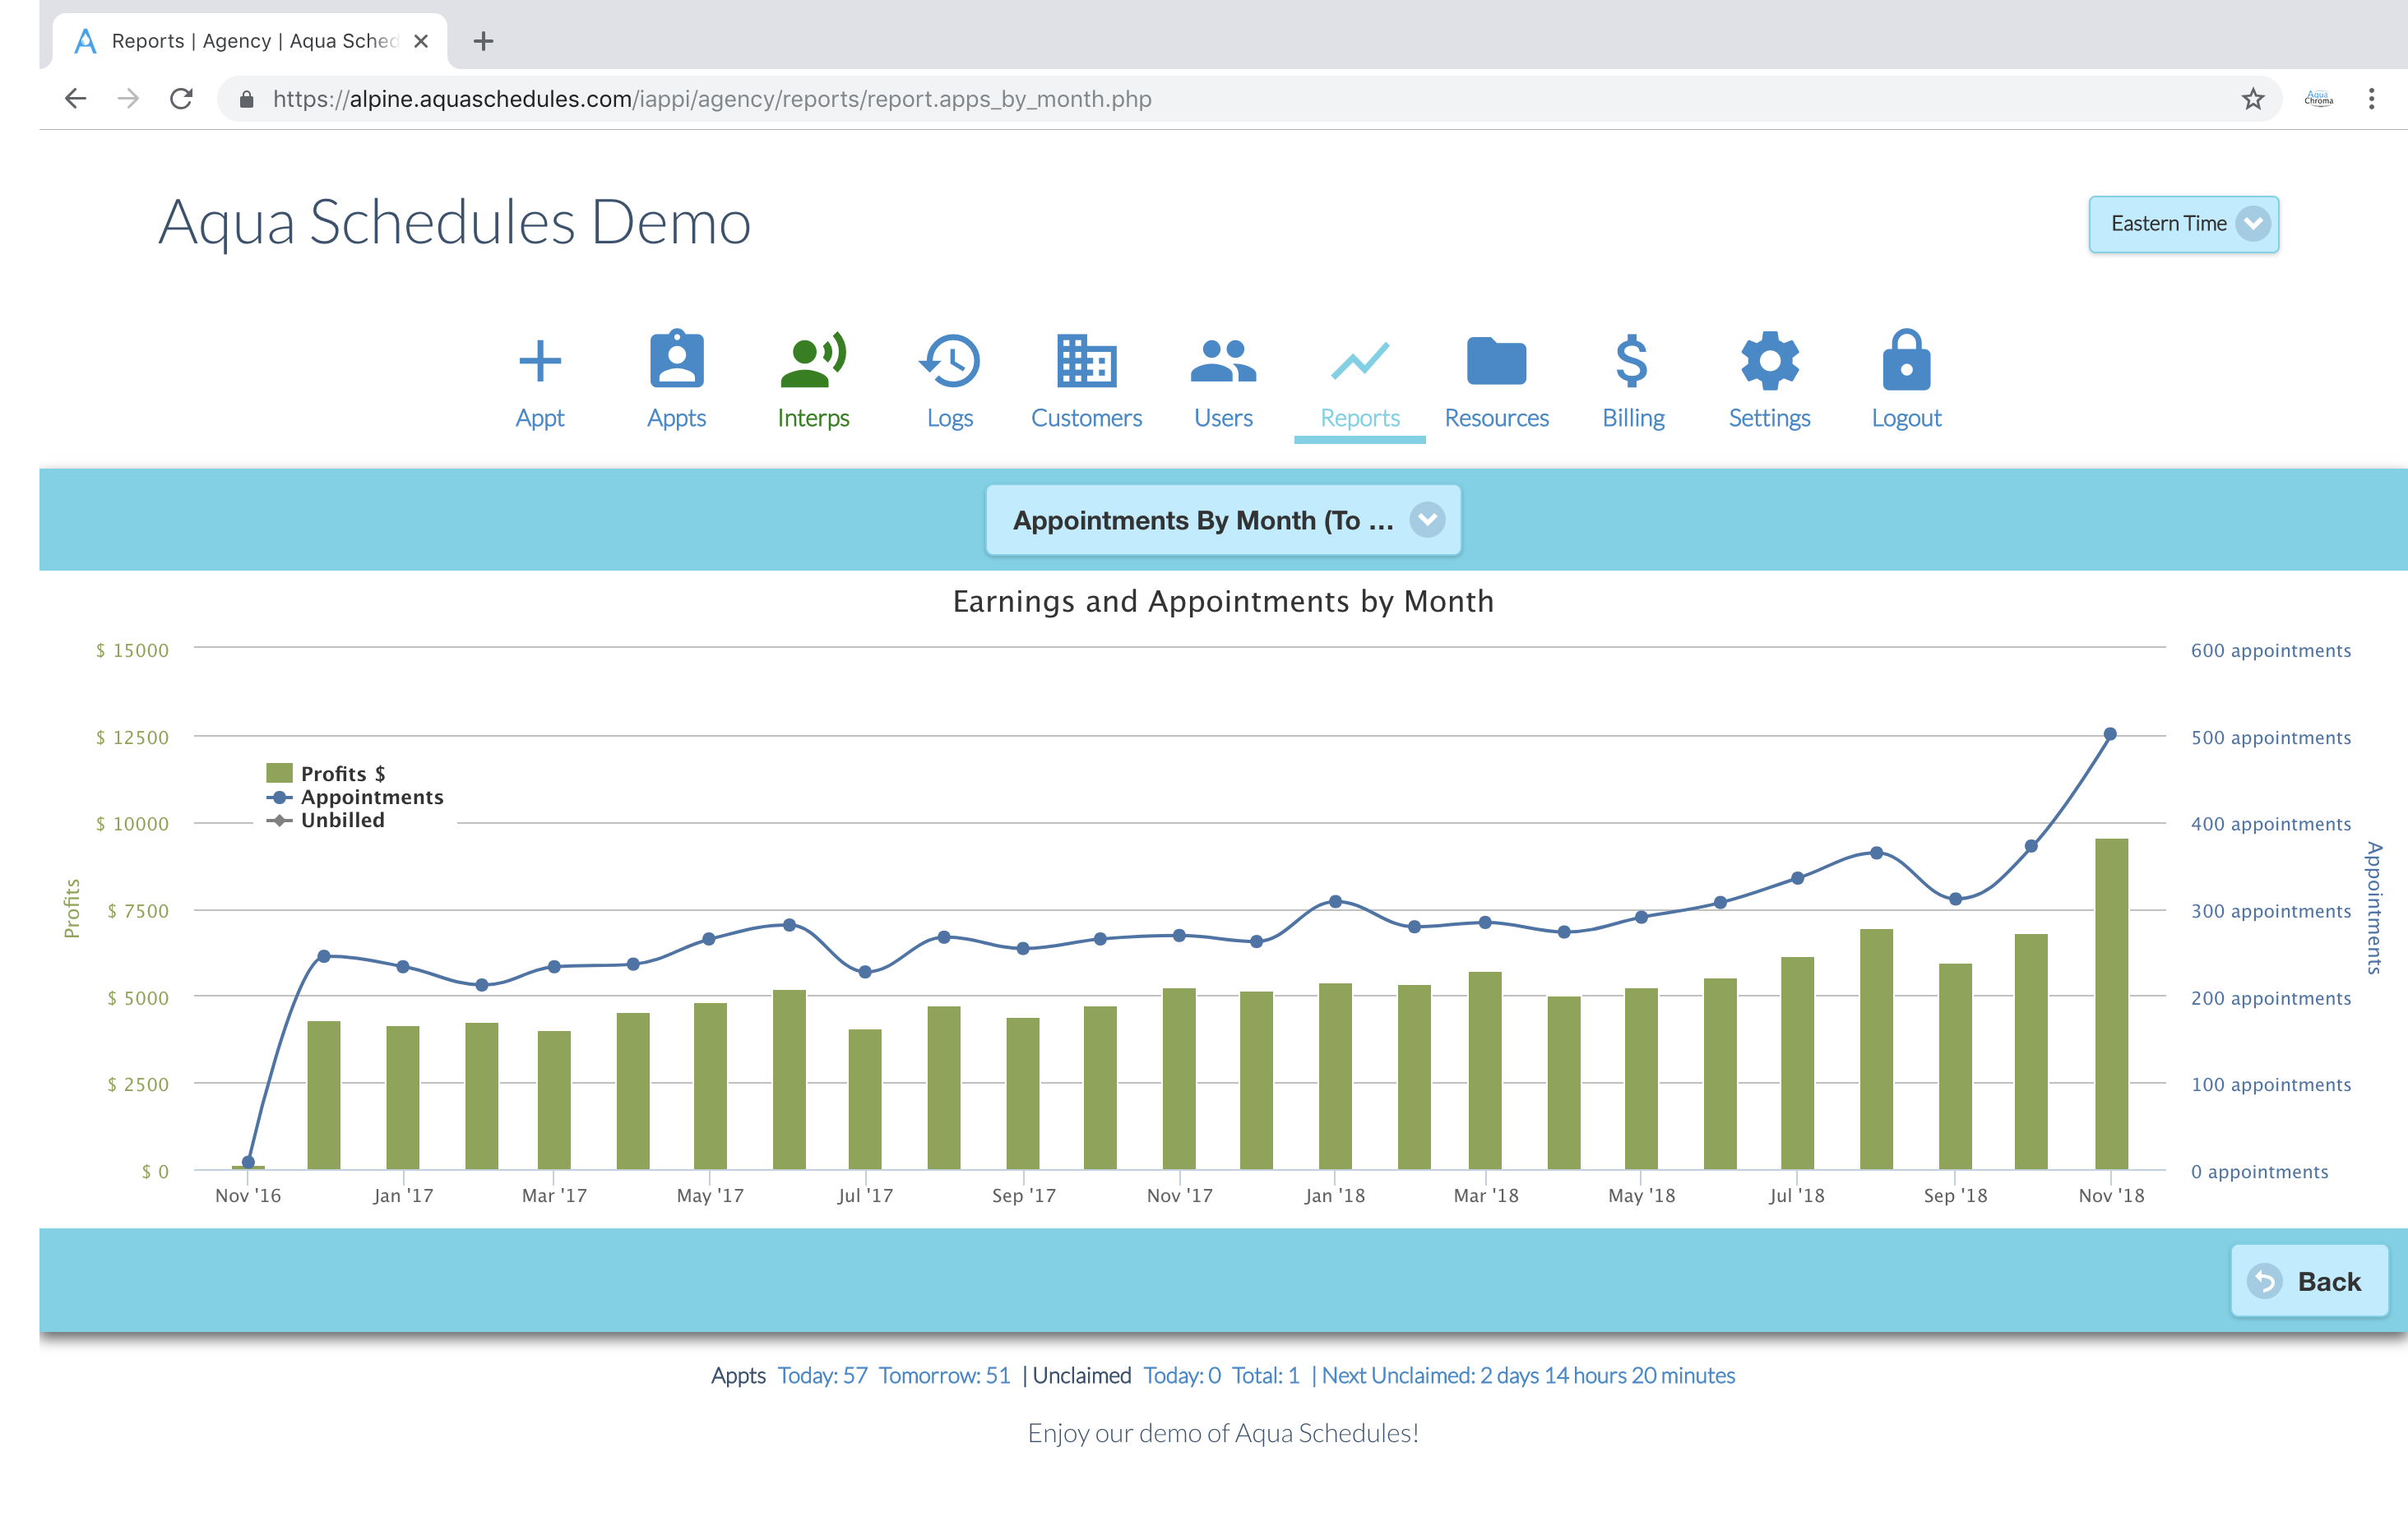
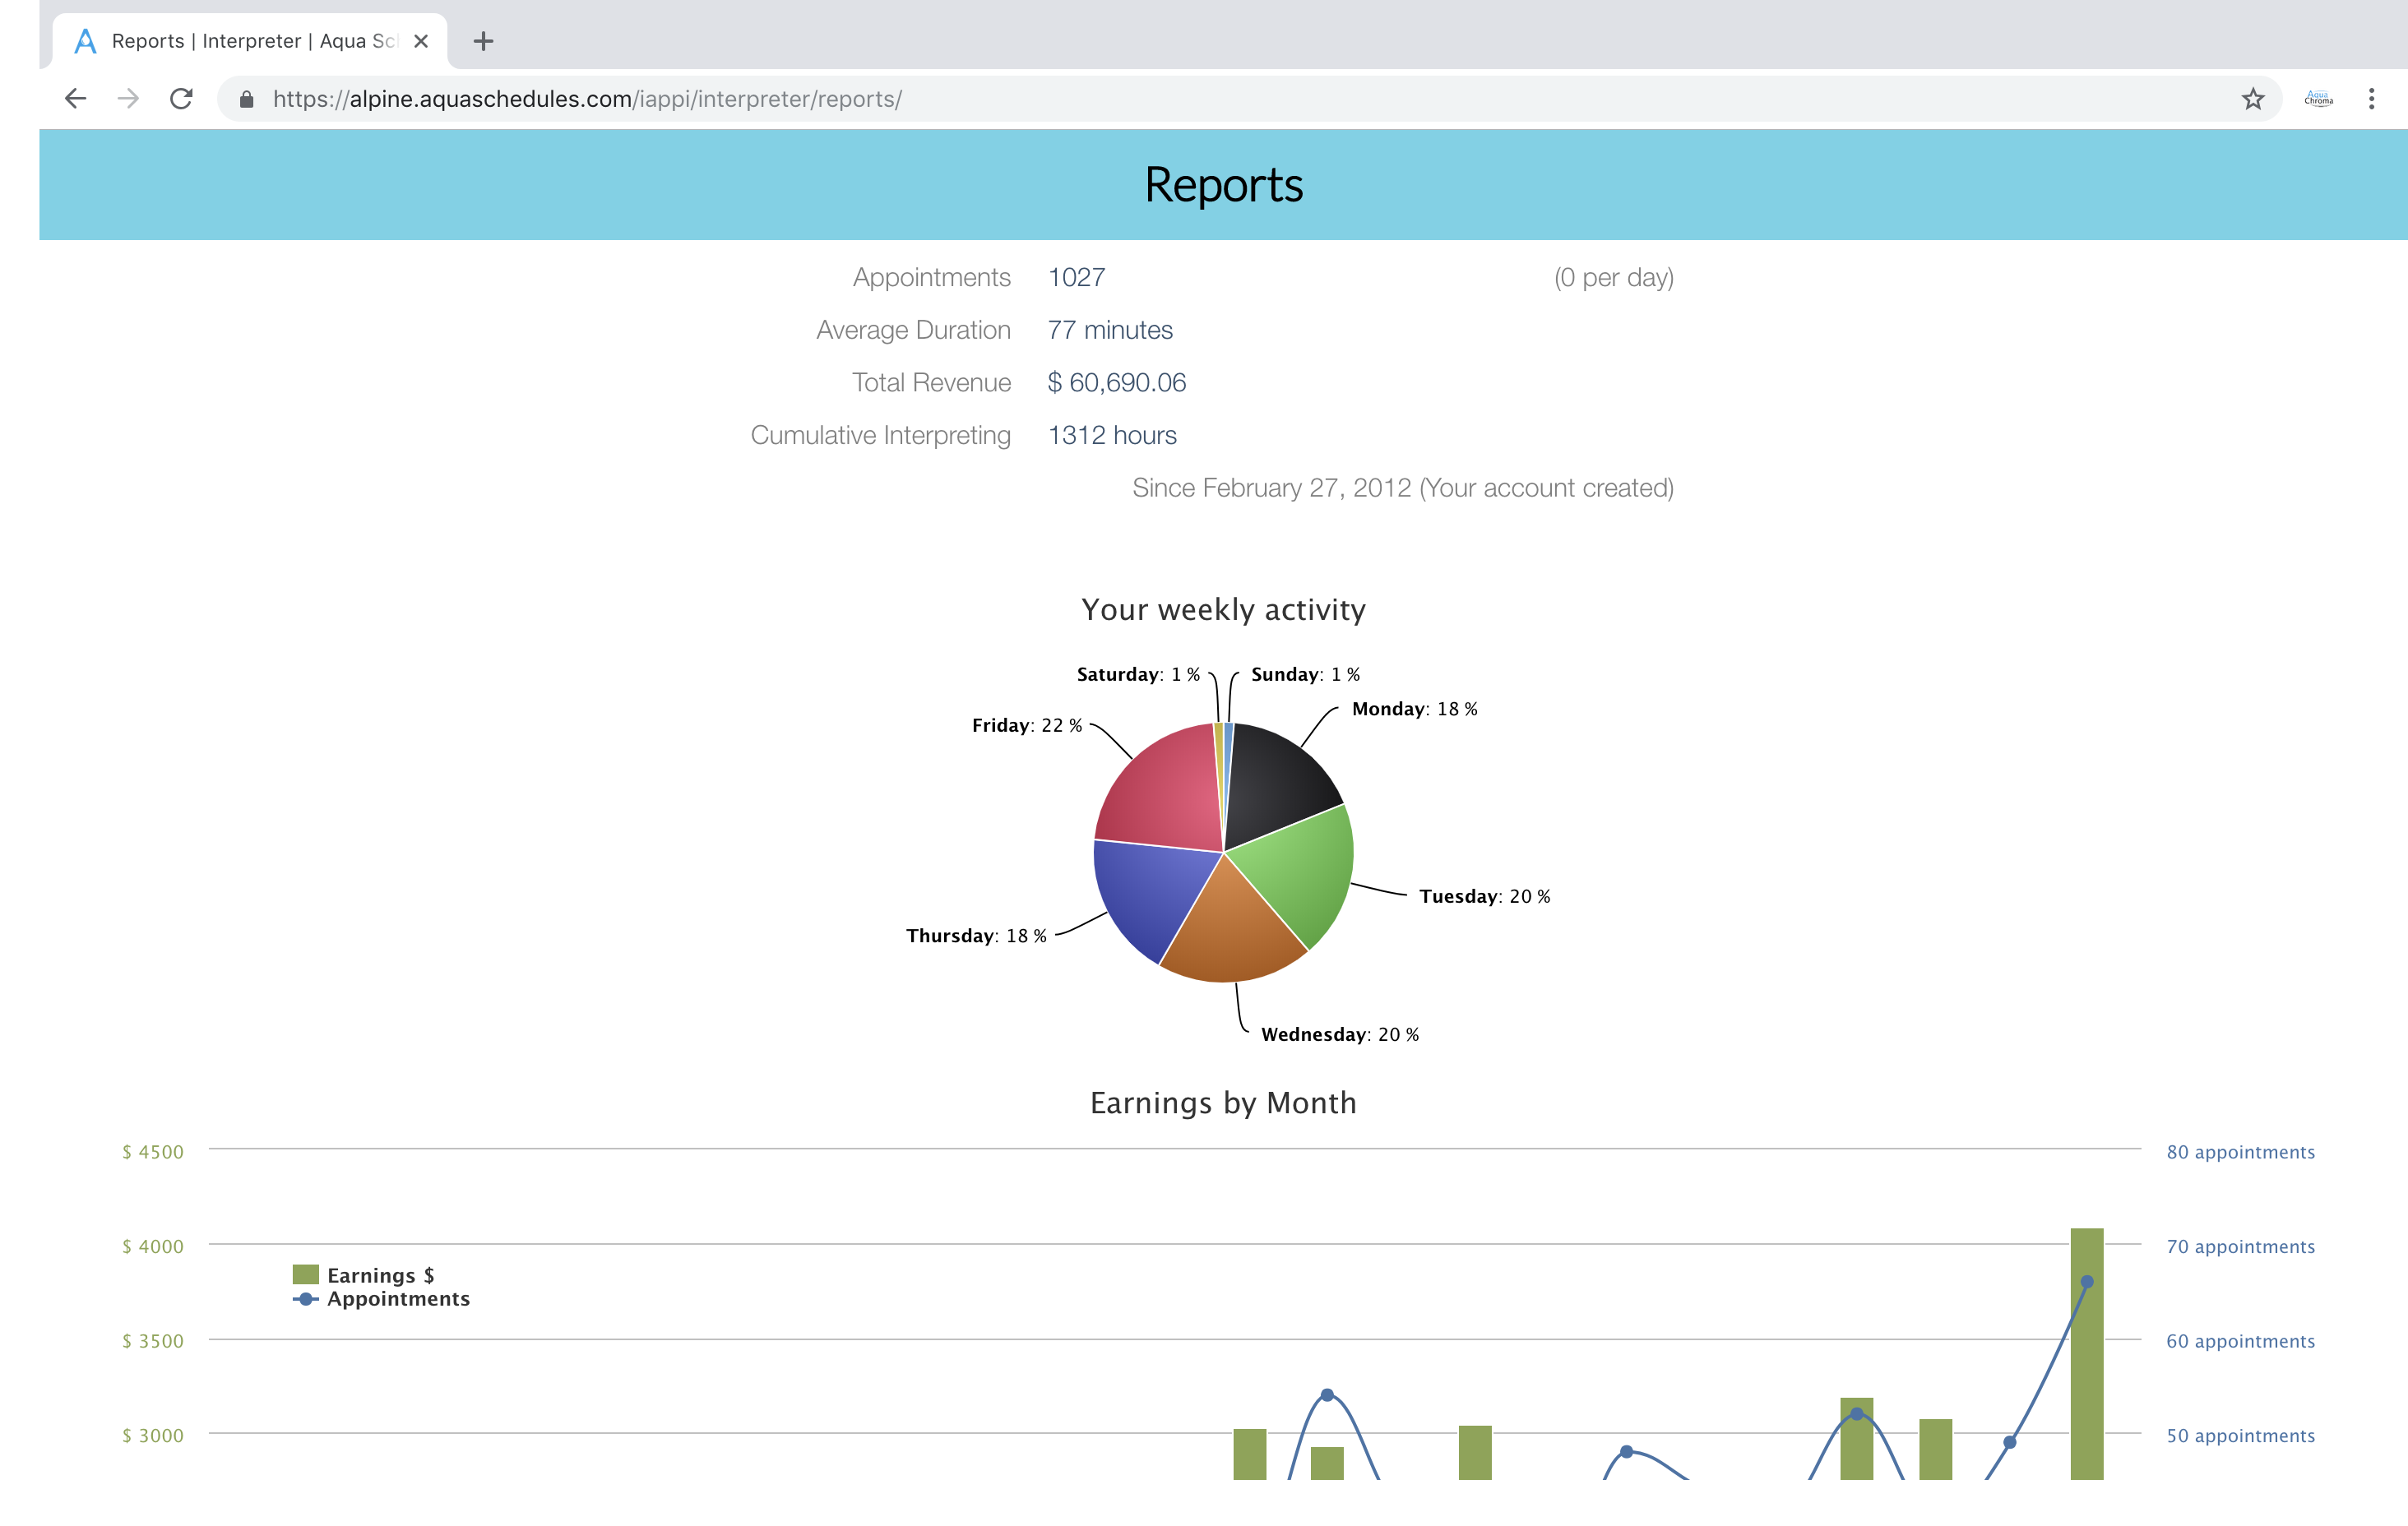
A bar chart of profits, line chart of appointments, and line chart of unbilled appointments all stacked into the same graph.
Read More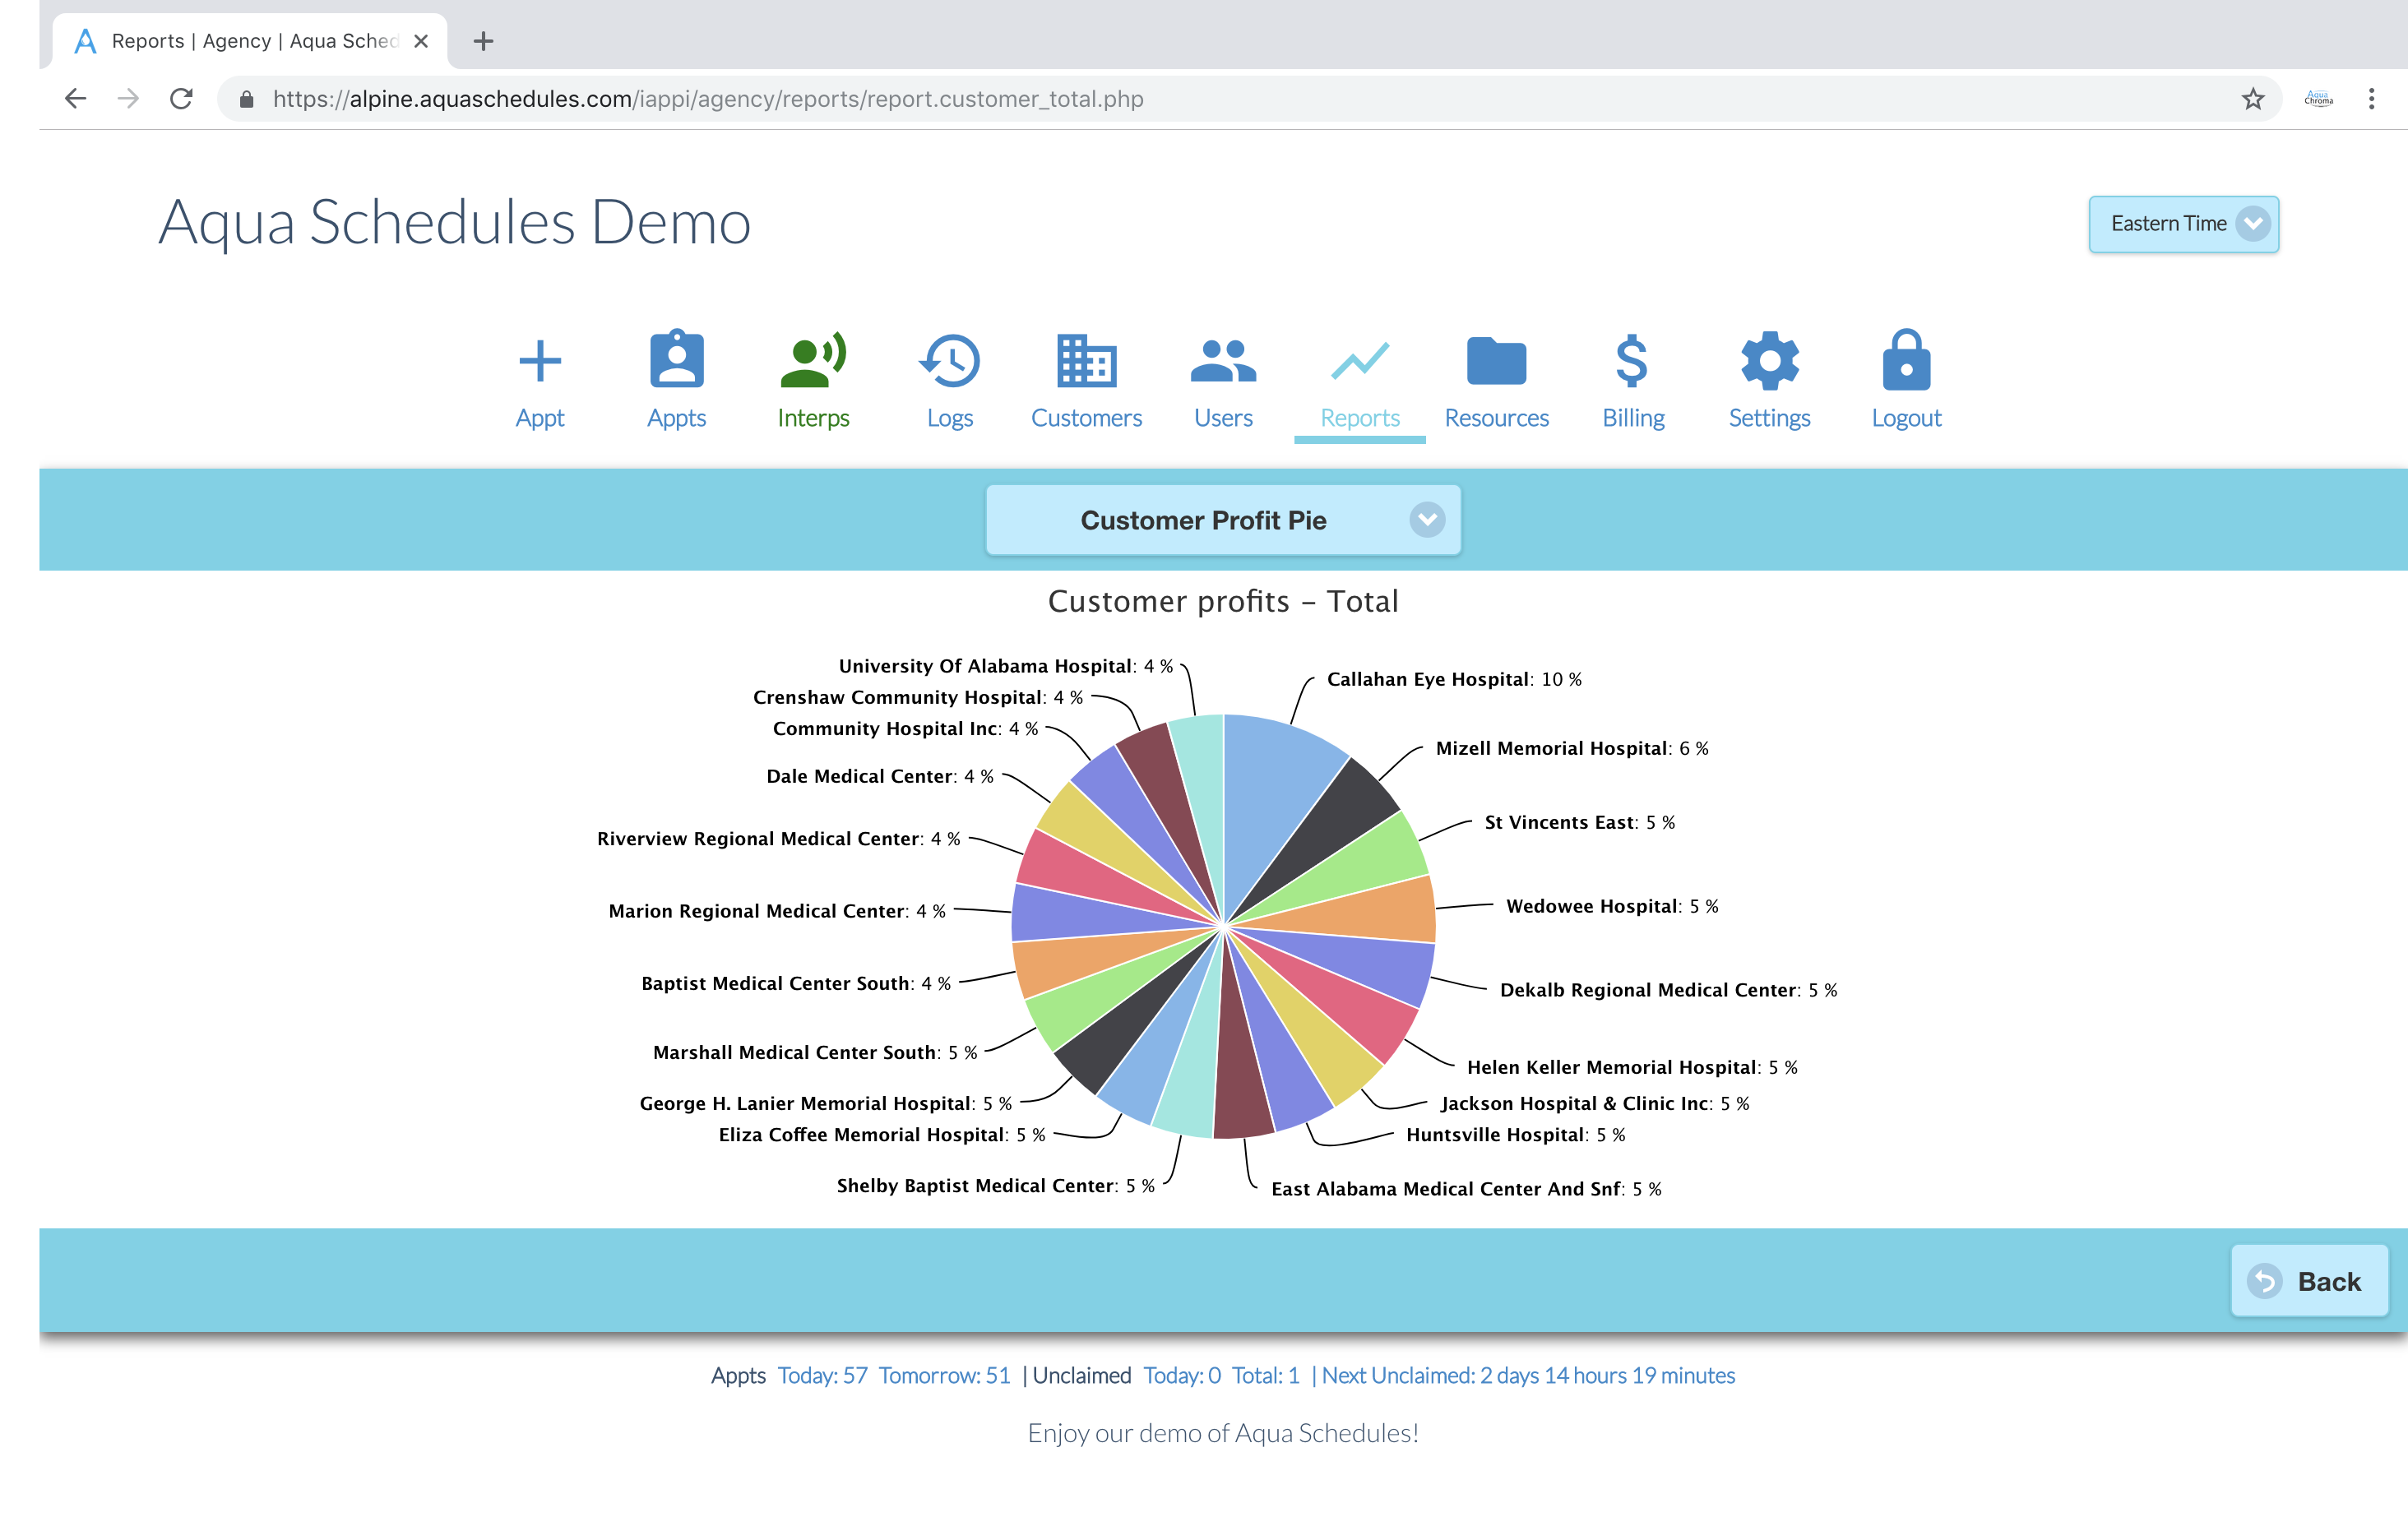
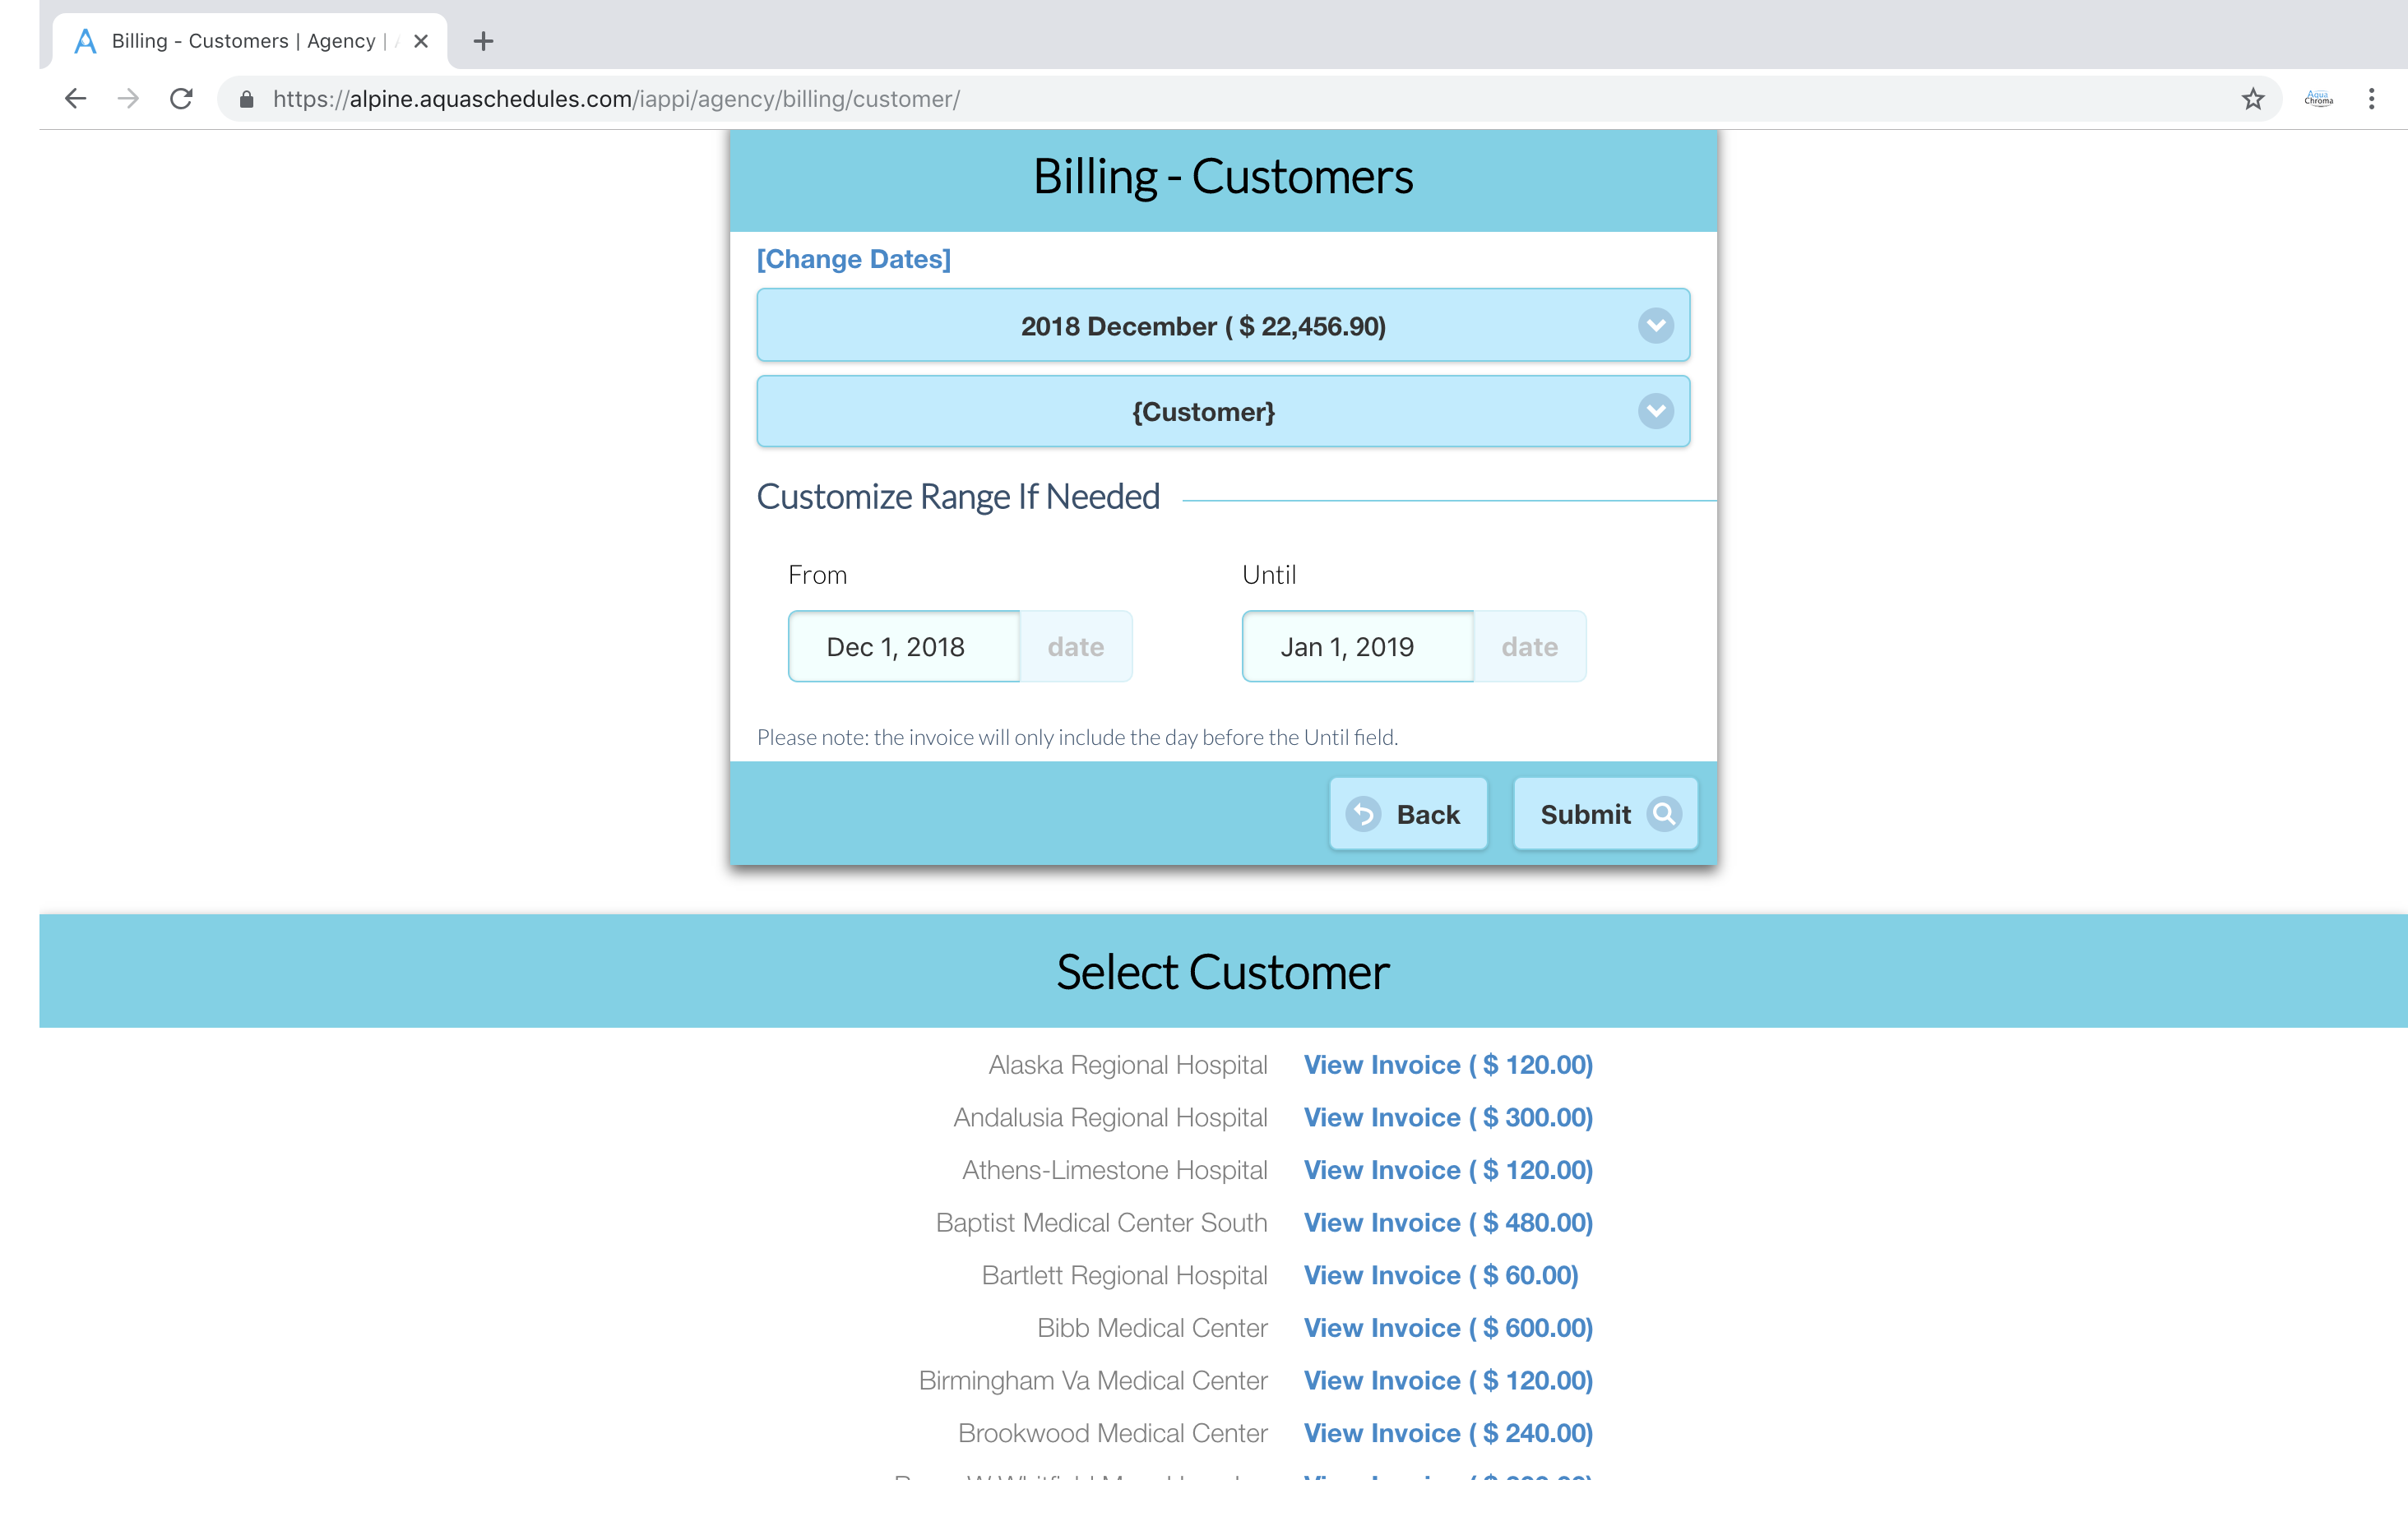
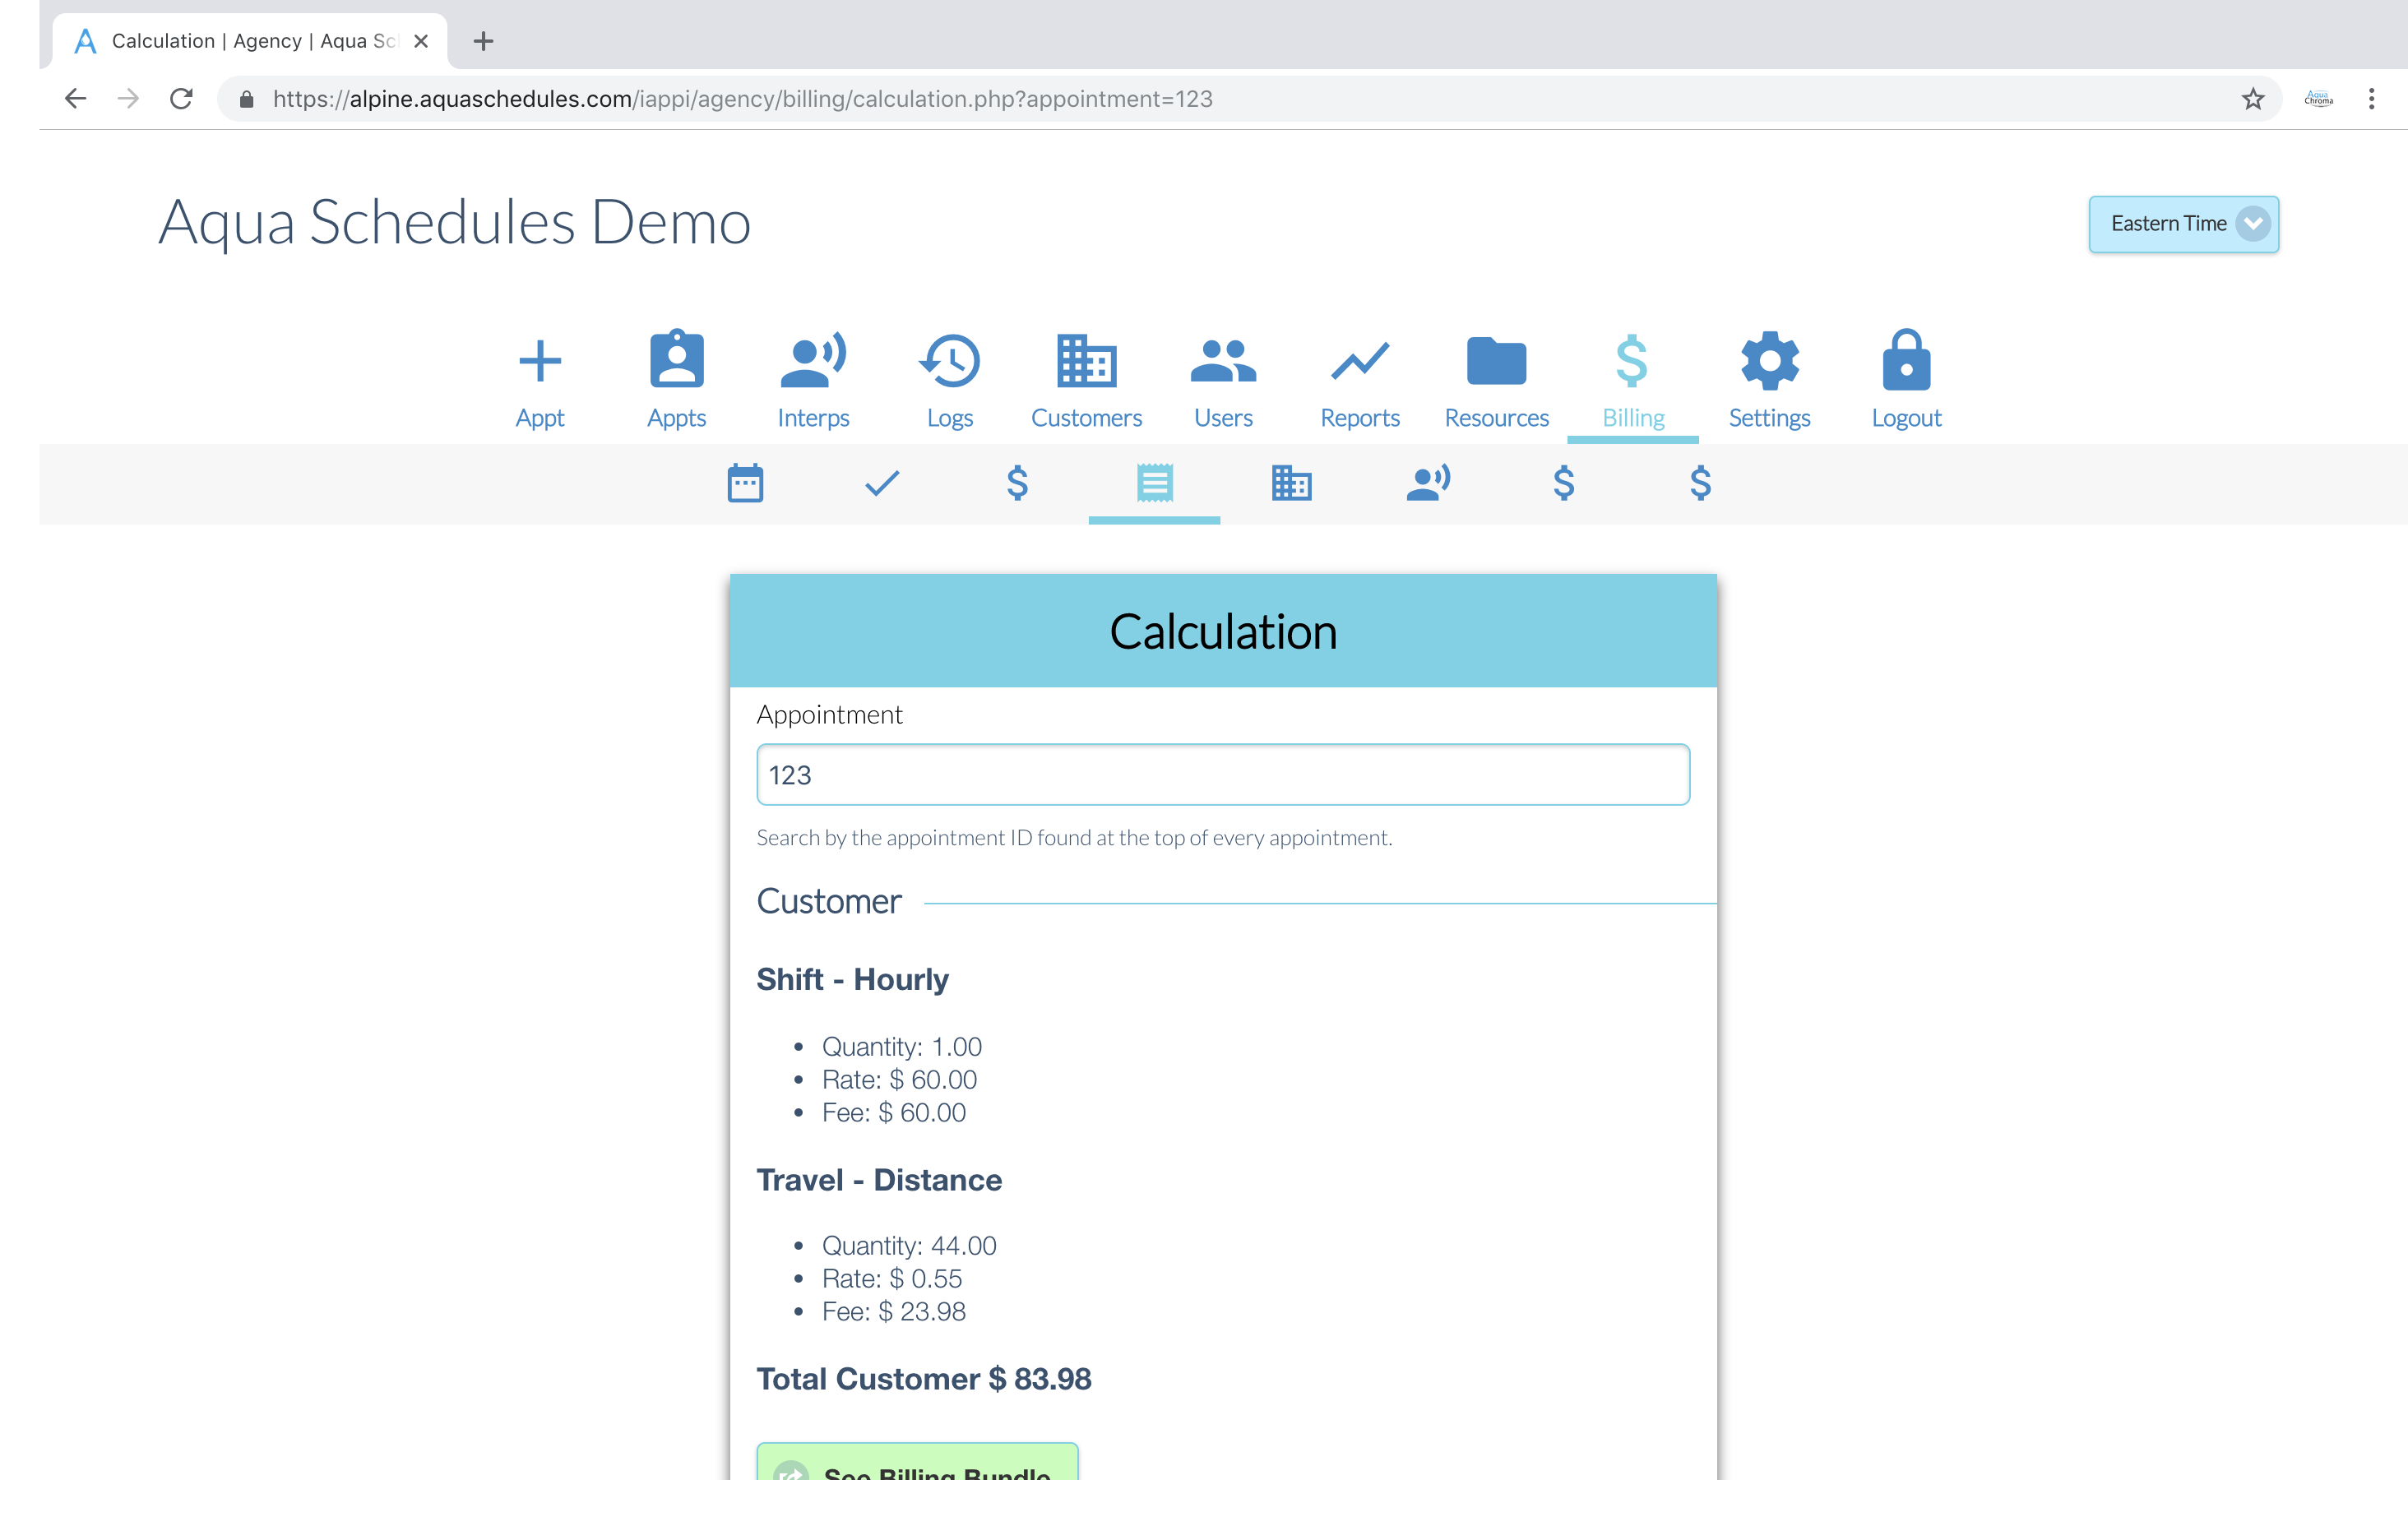
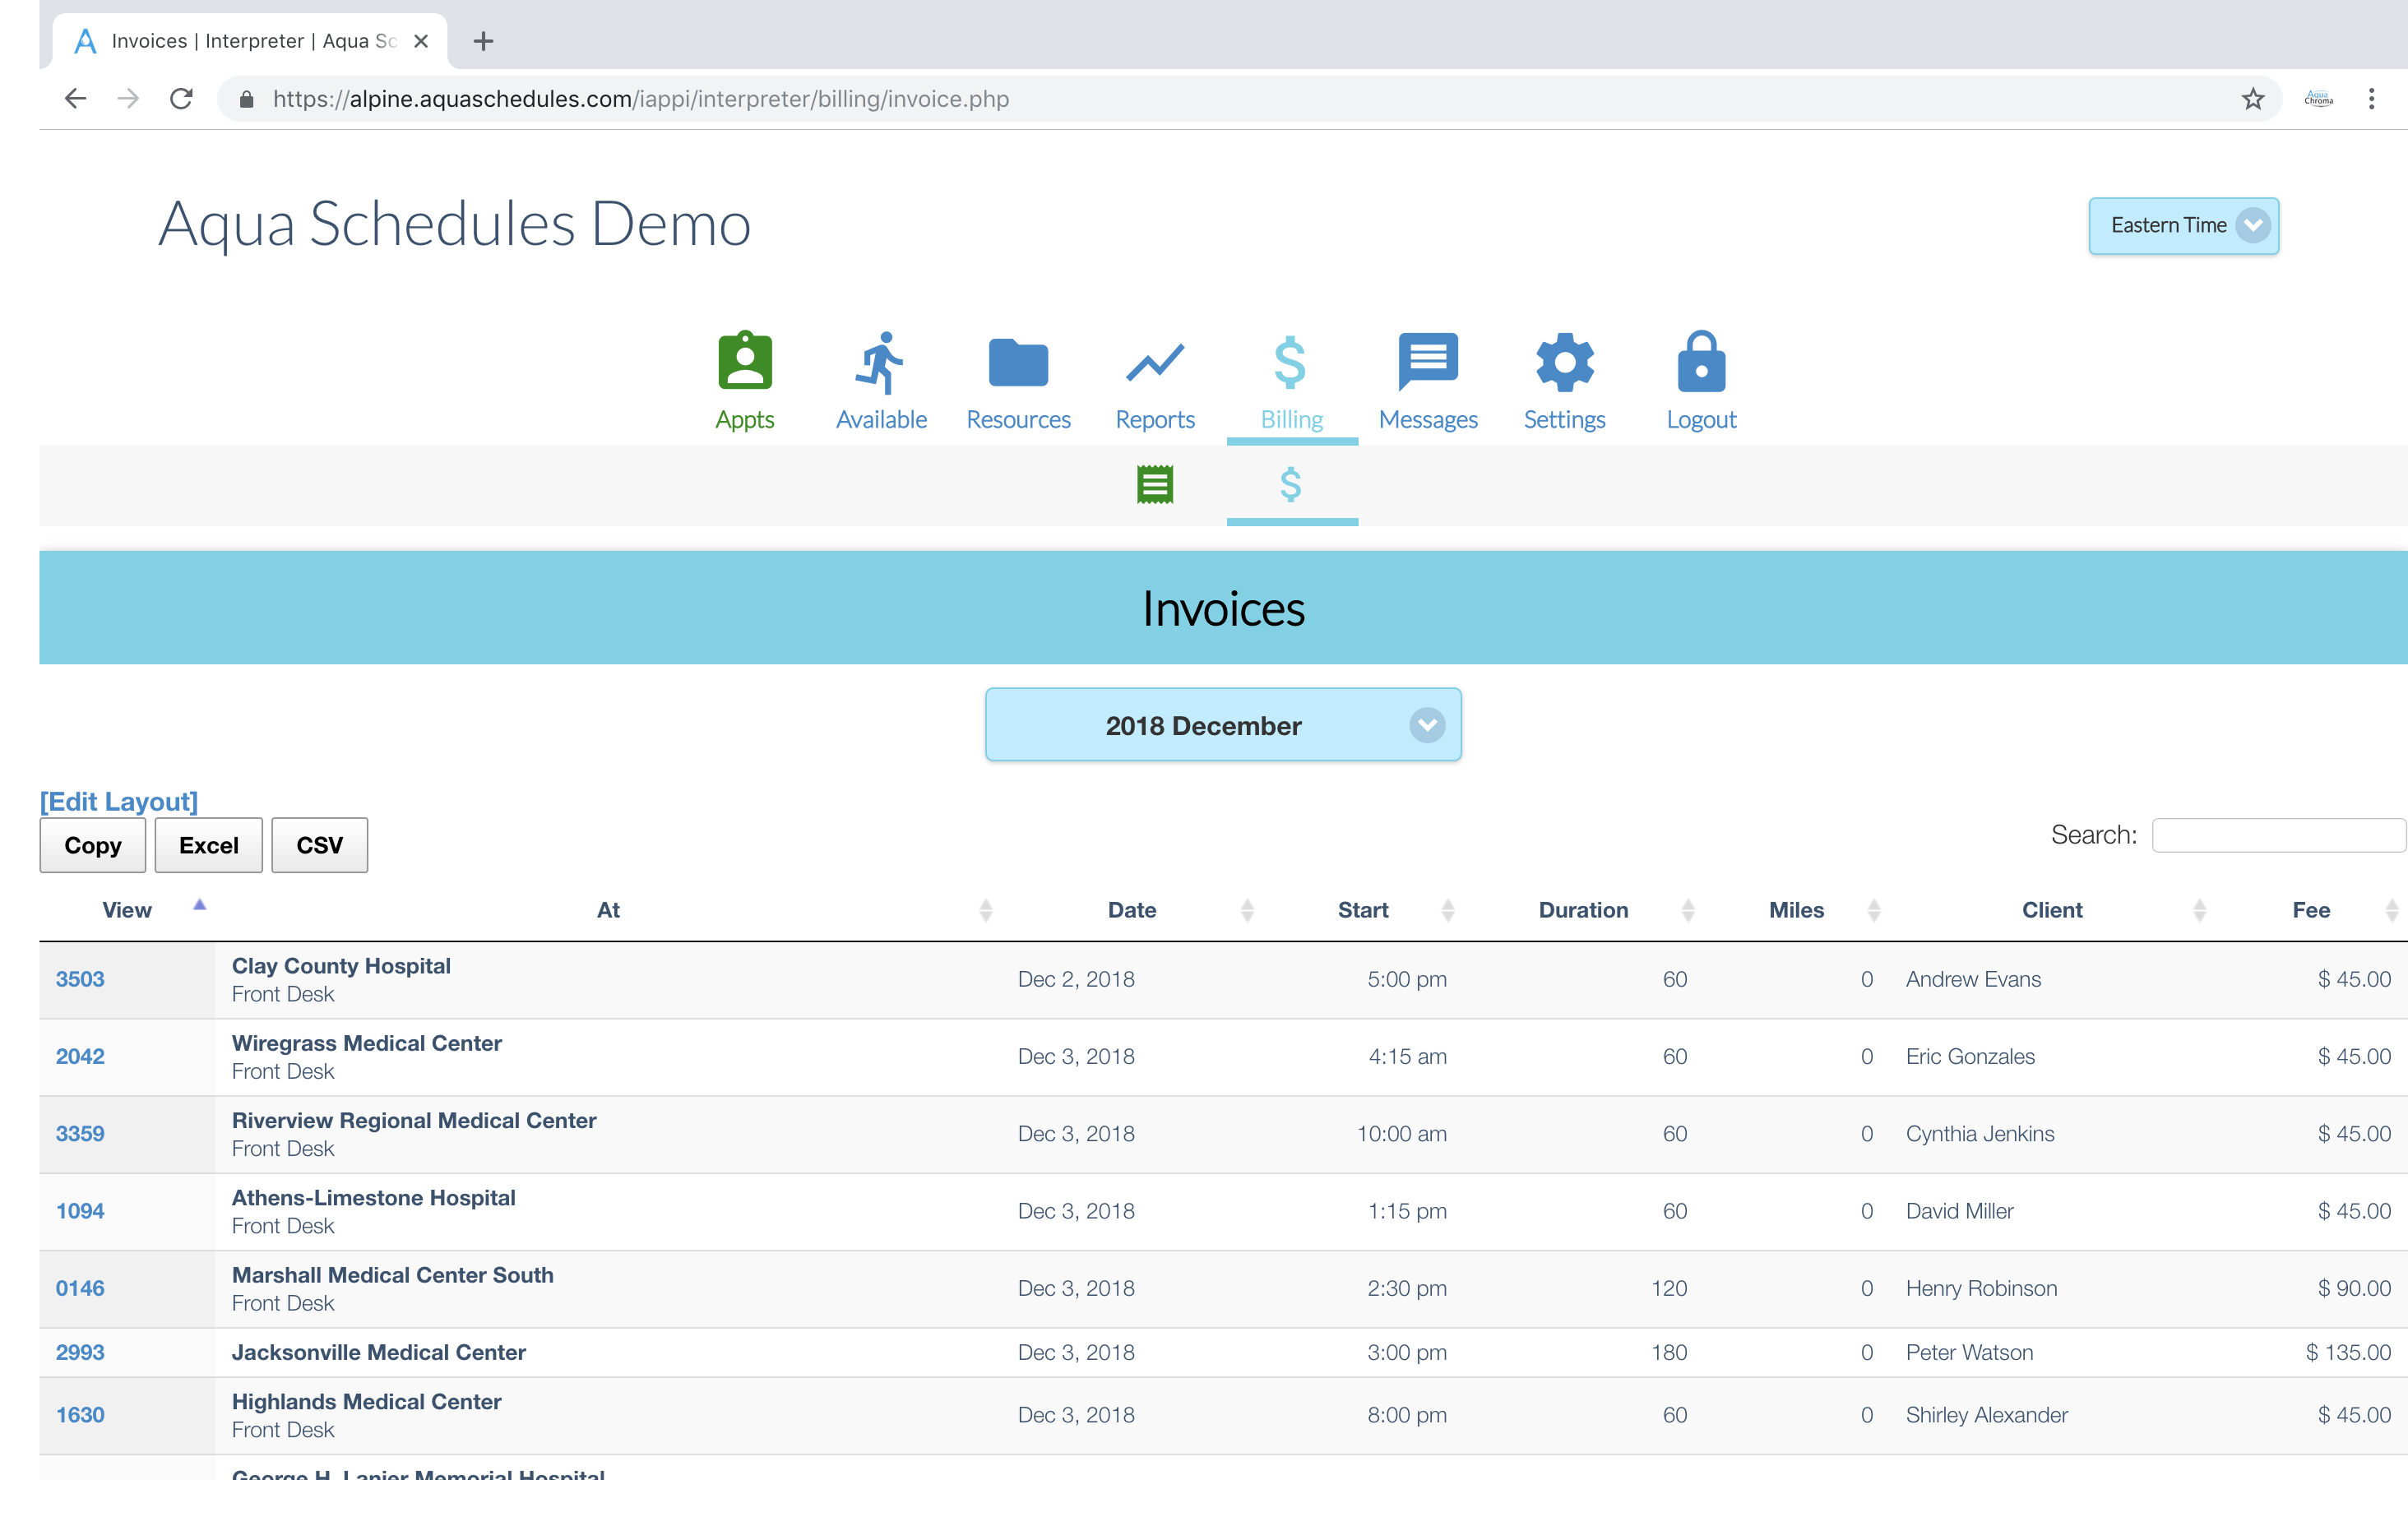
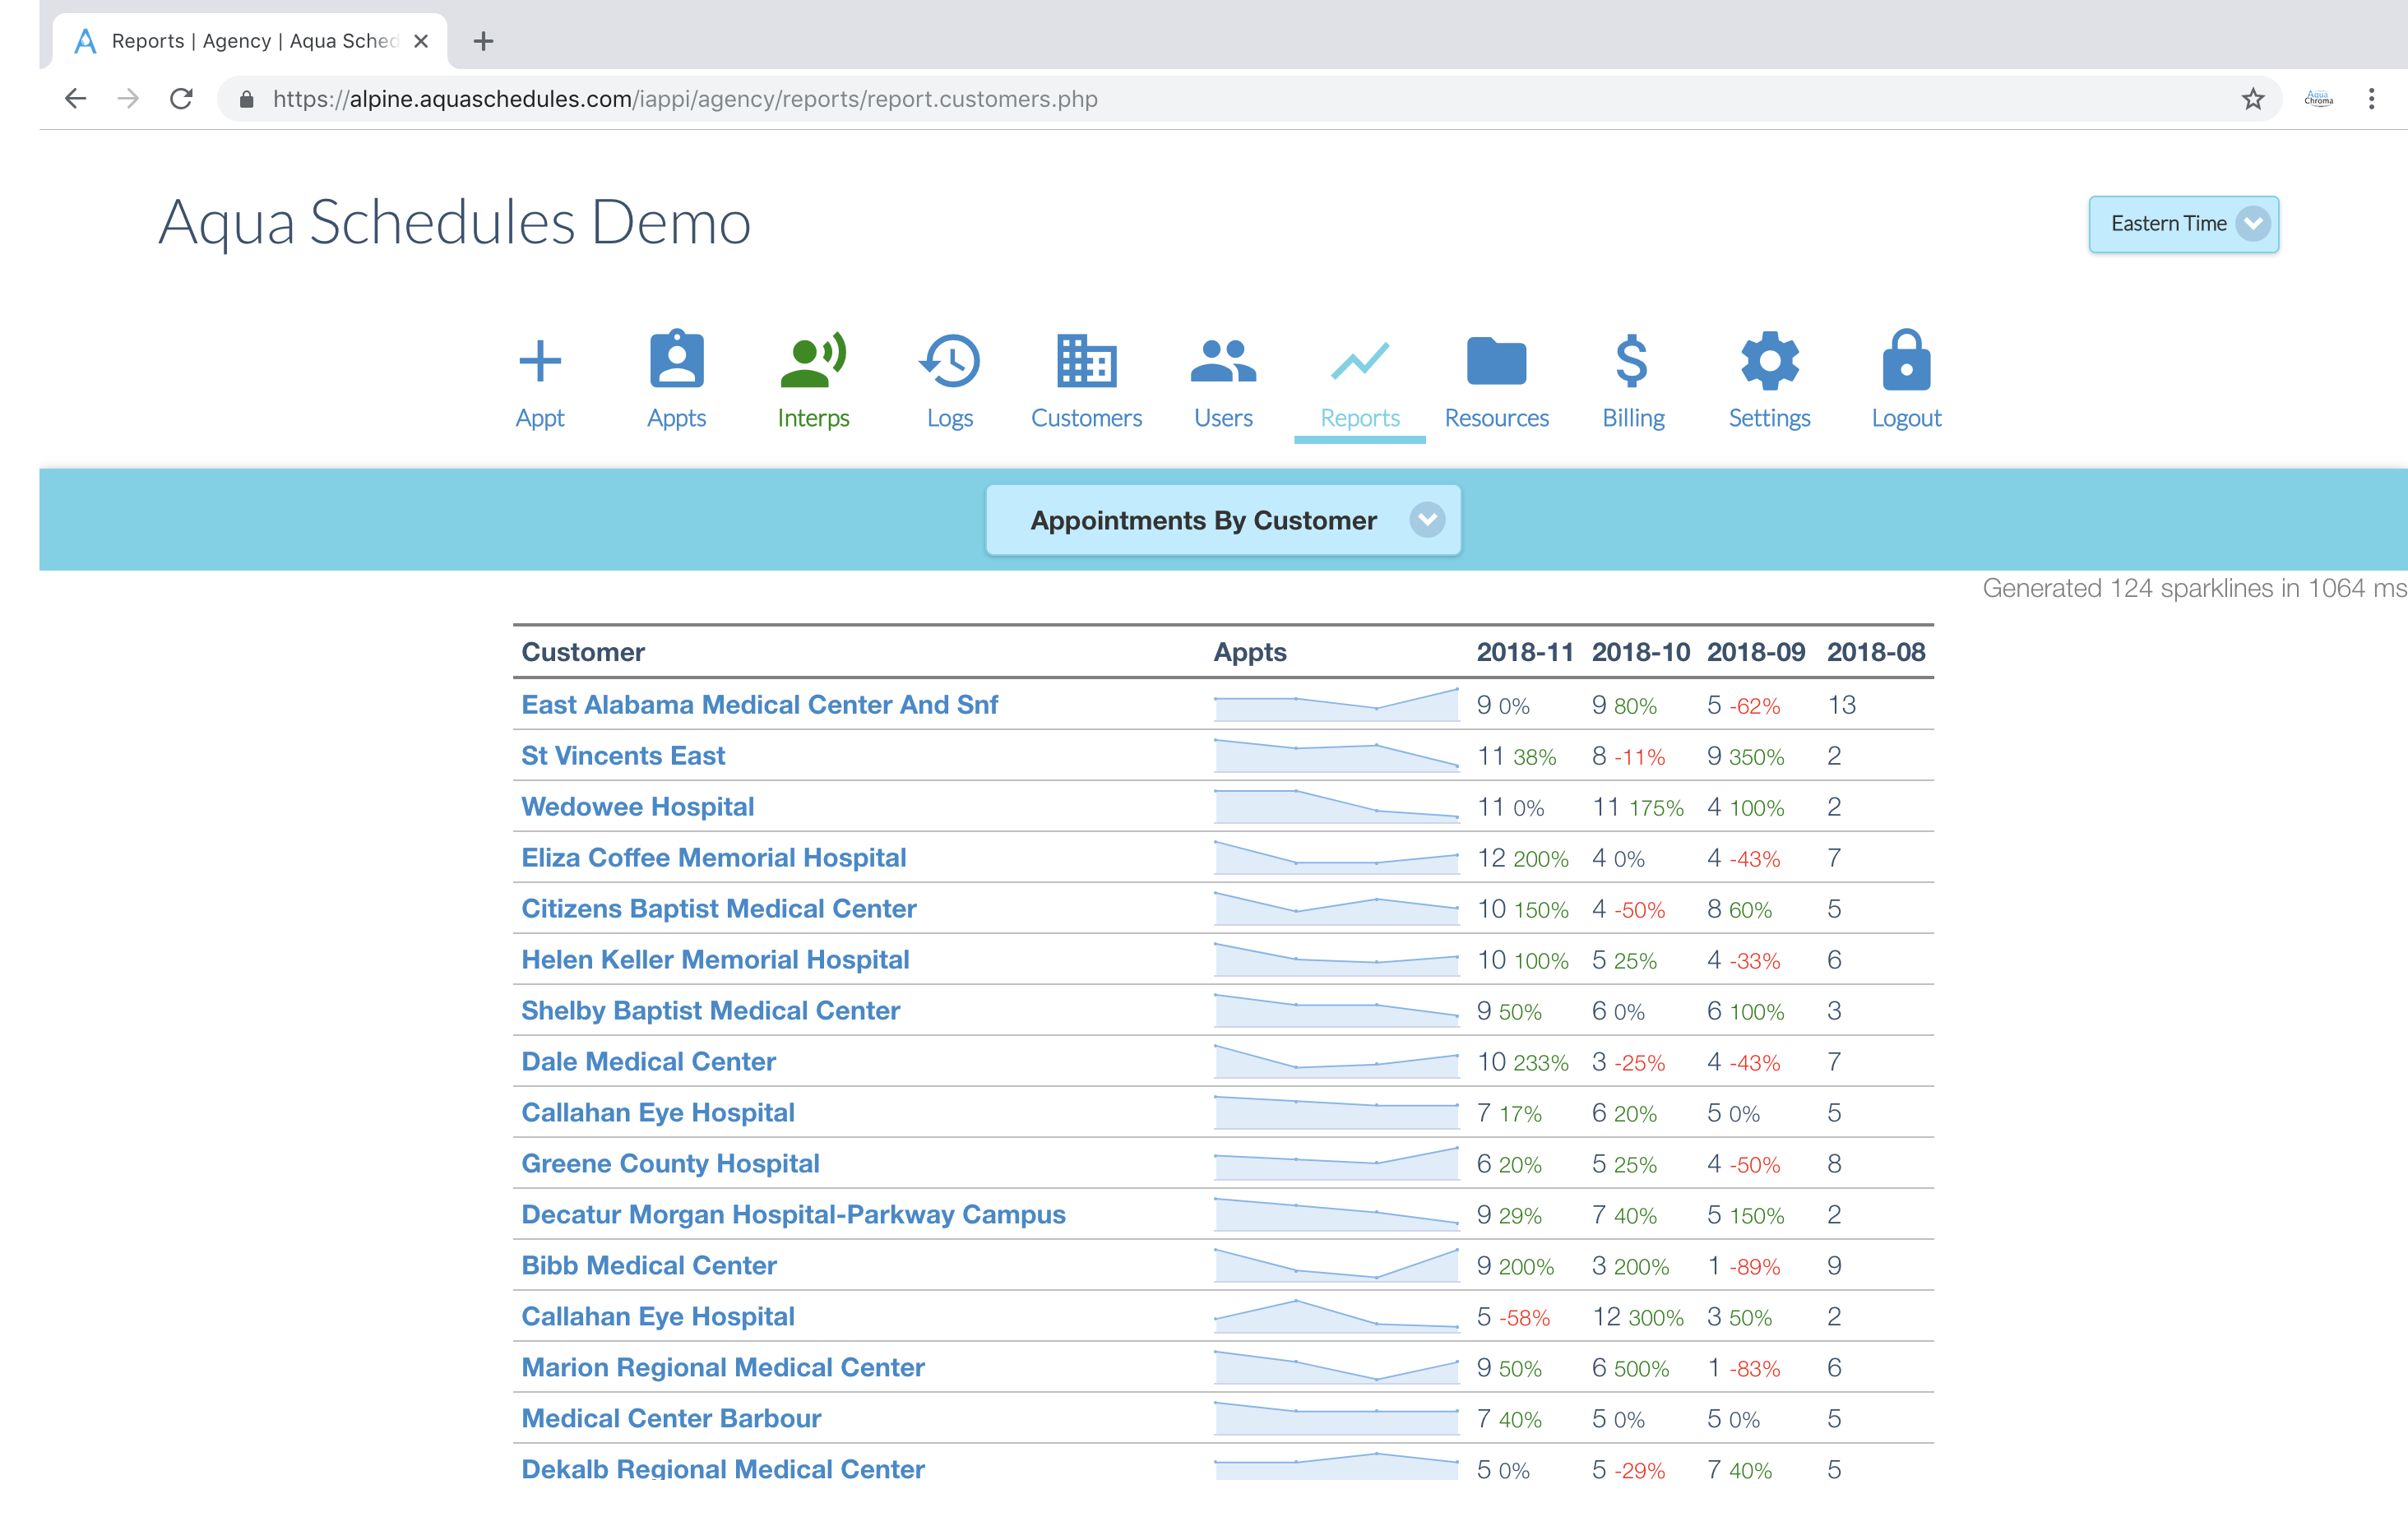
See a pie chart of the percentage each customer contributed for a billing cycles profits.
Read More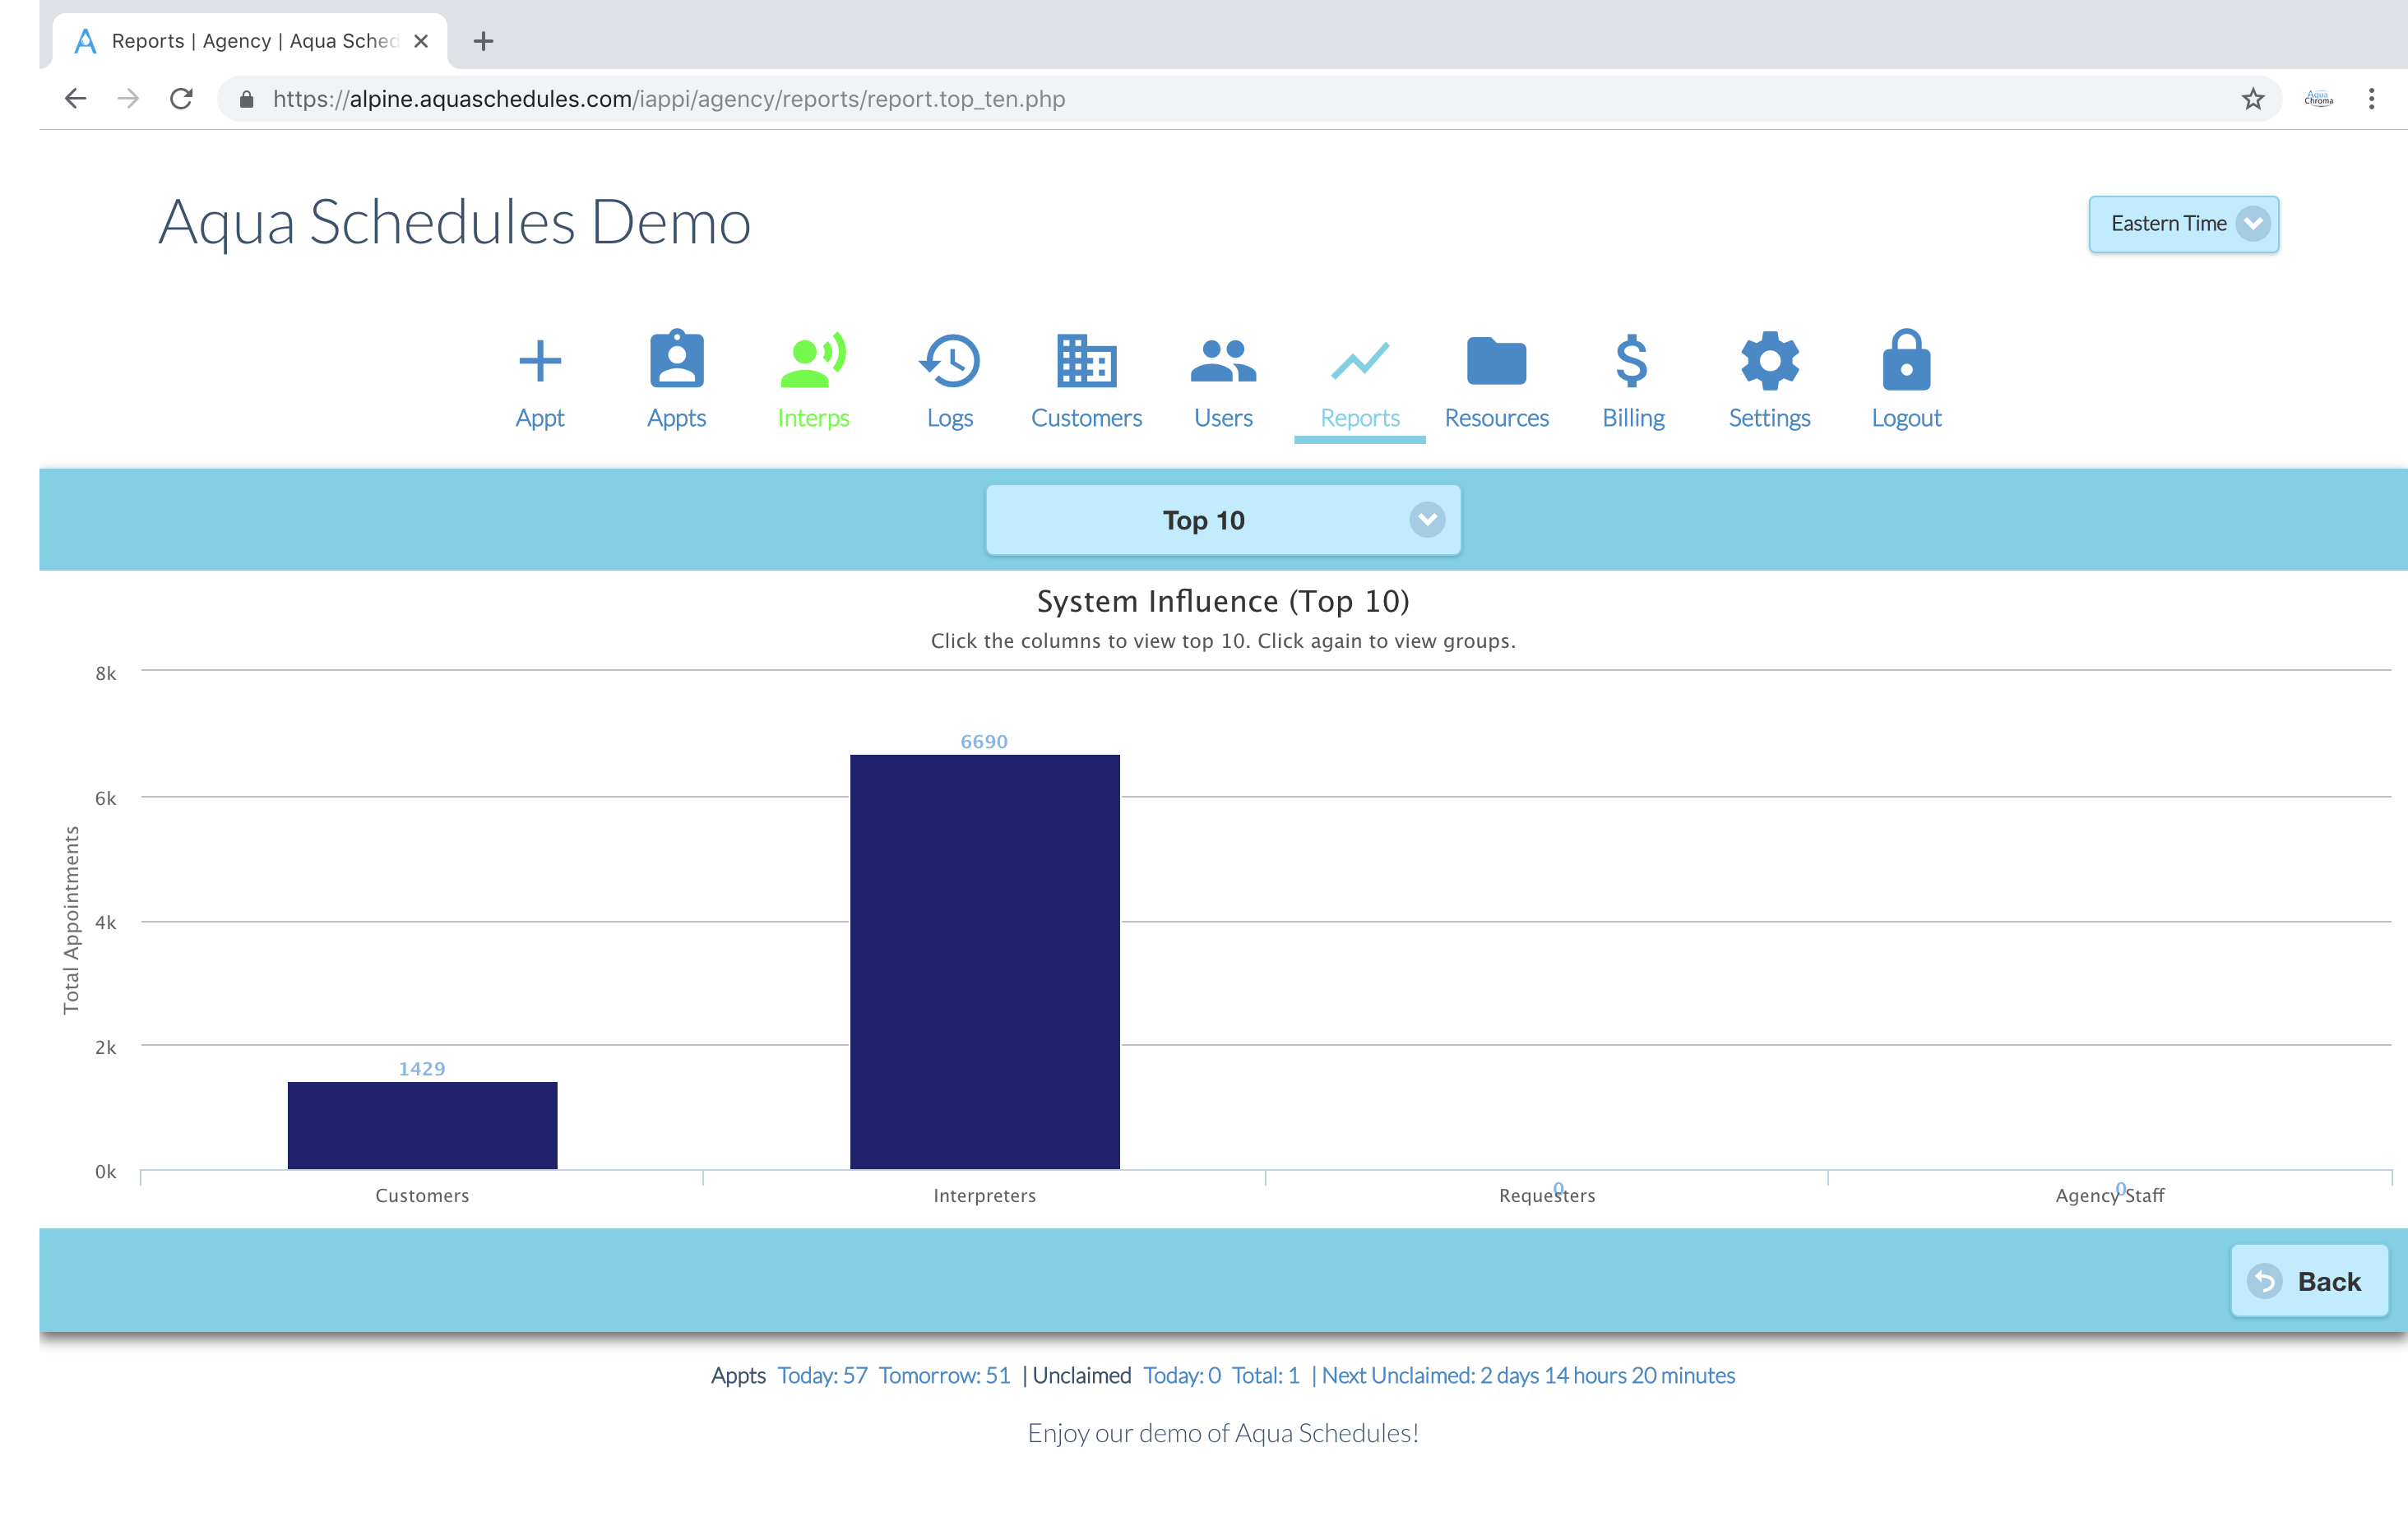
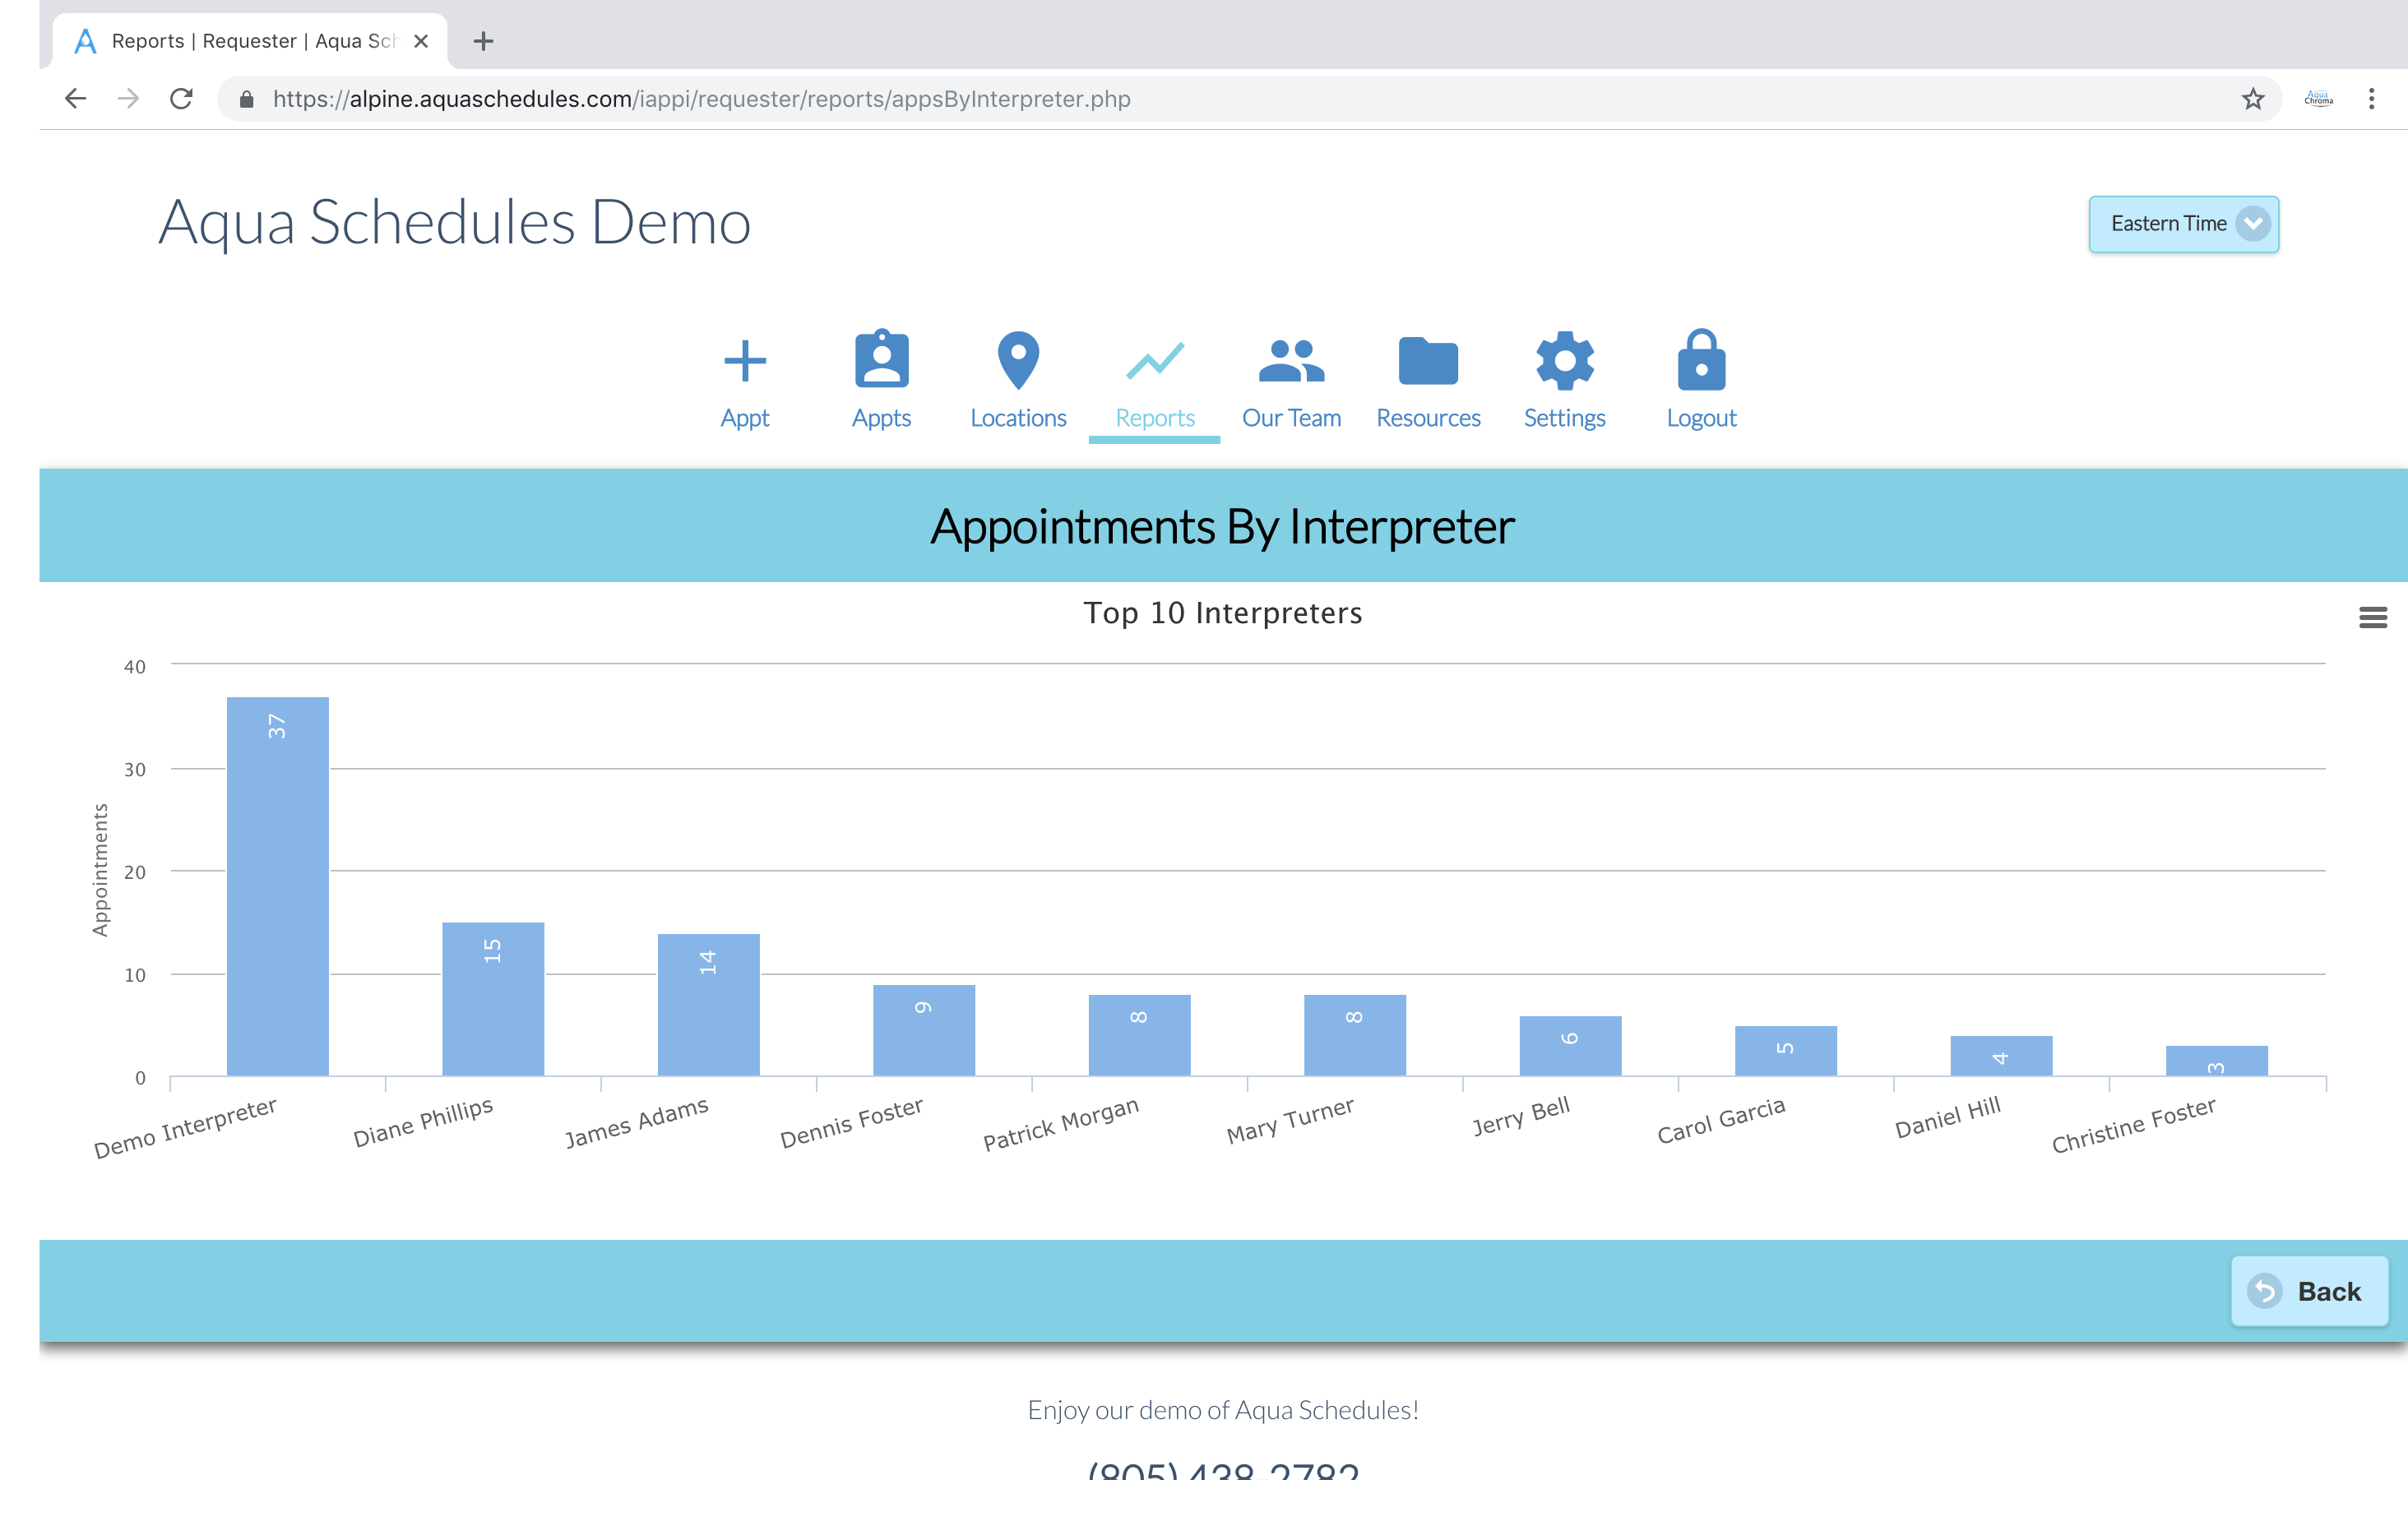
Bar charts of the total number of appointments created by requesters, appointed to interpreters, or created by agency staff.
Read More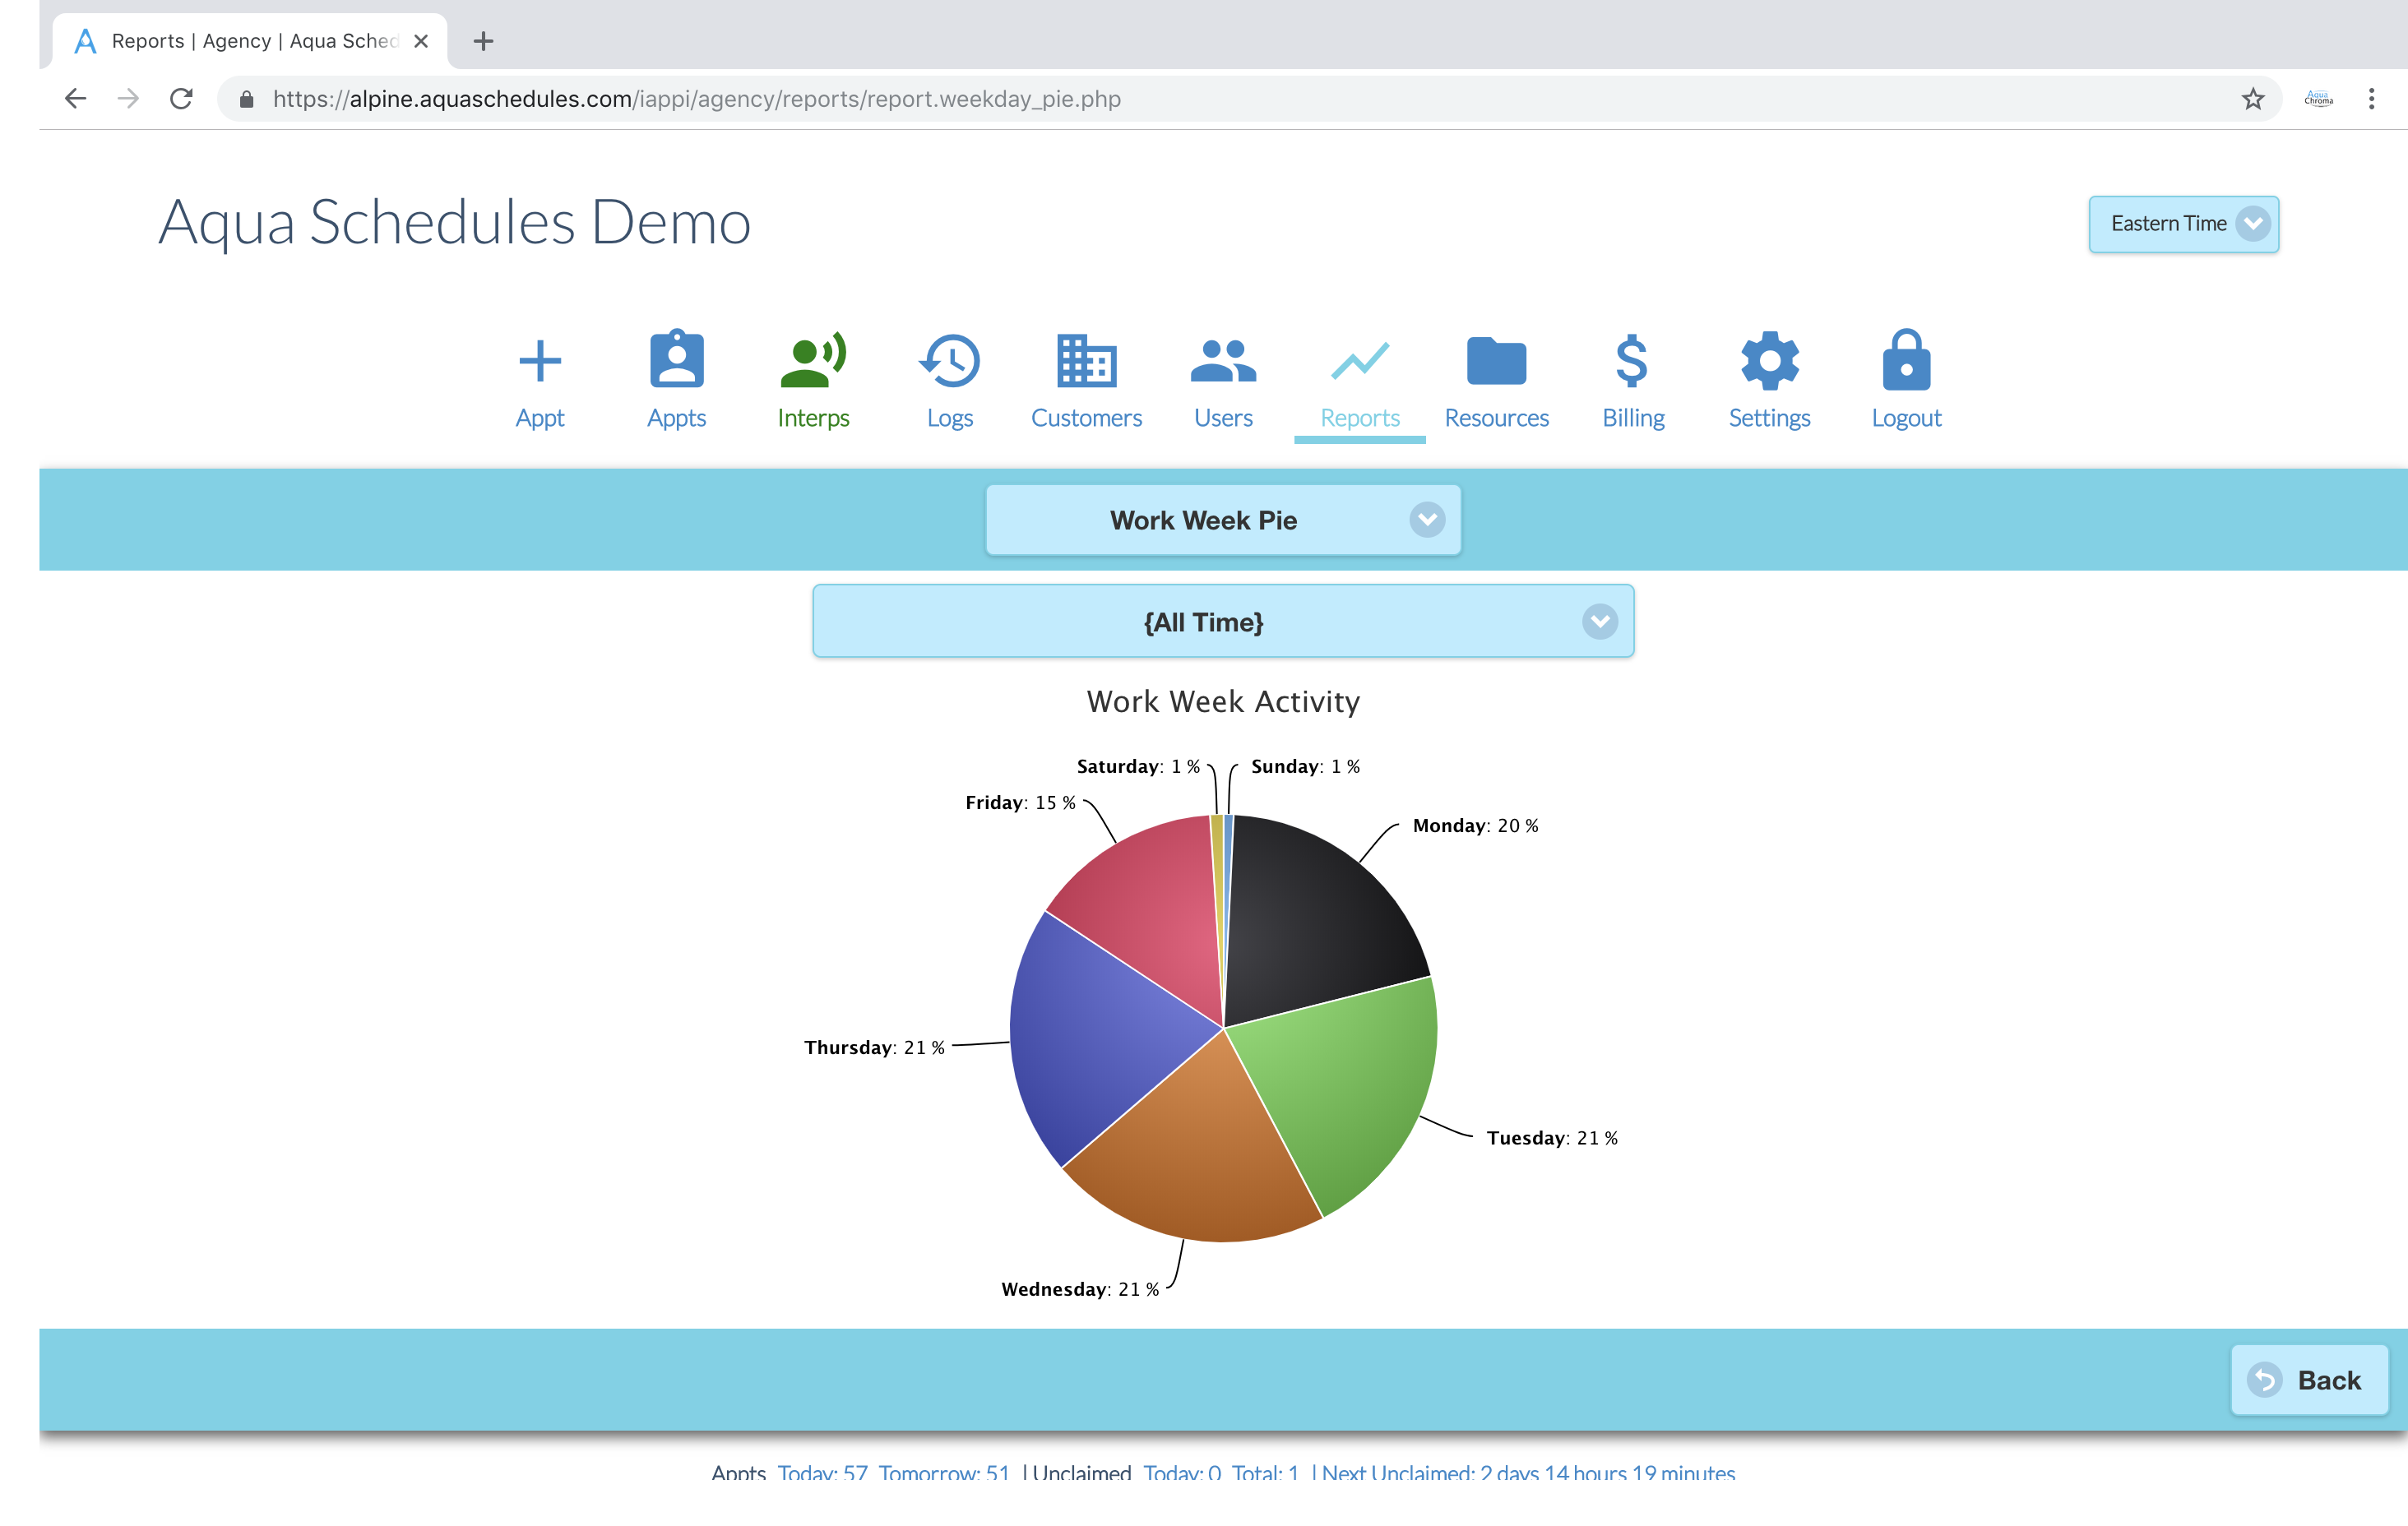
1 (805) GET-AQUA | 1.805.438.2782
Aqua Schedules. All Rights Reserved. Marketing Site Designed by HTML Codex