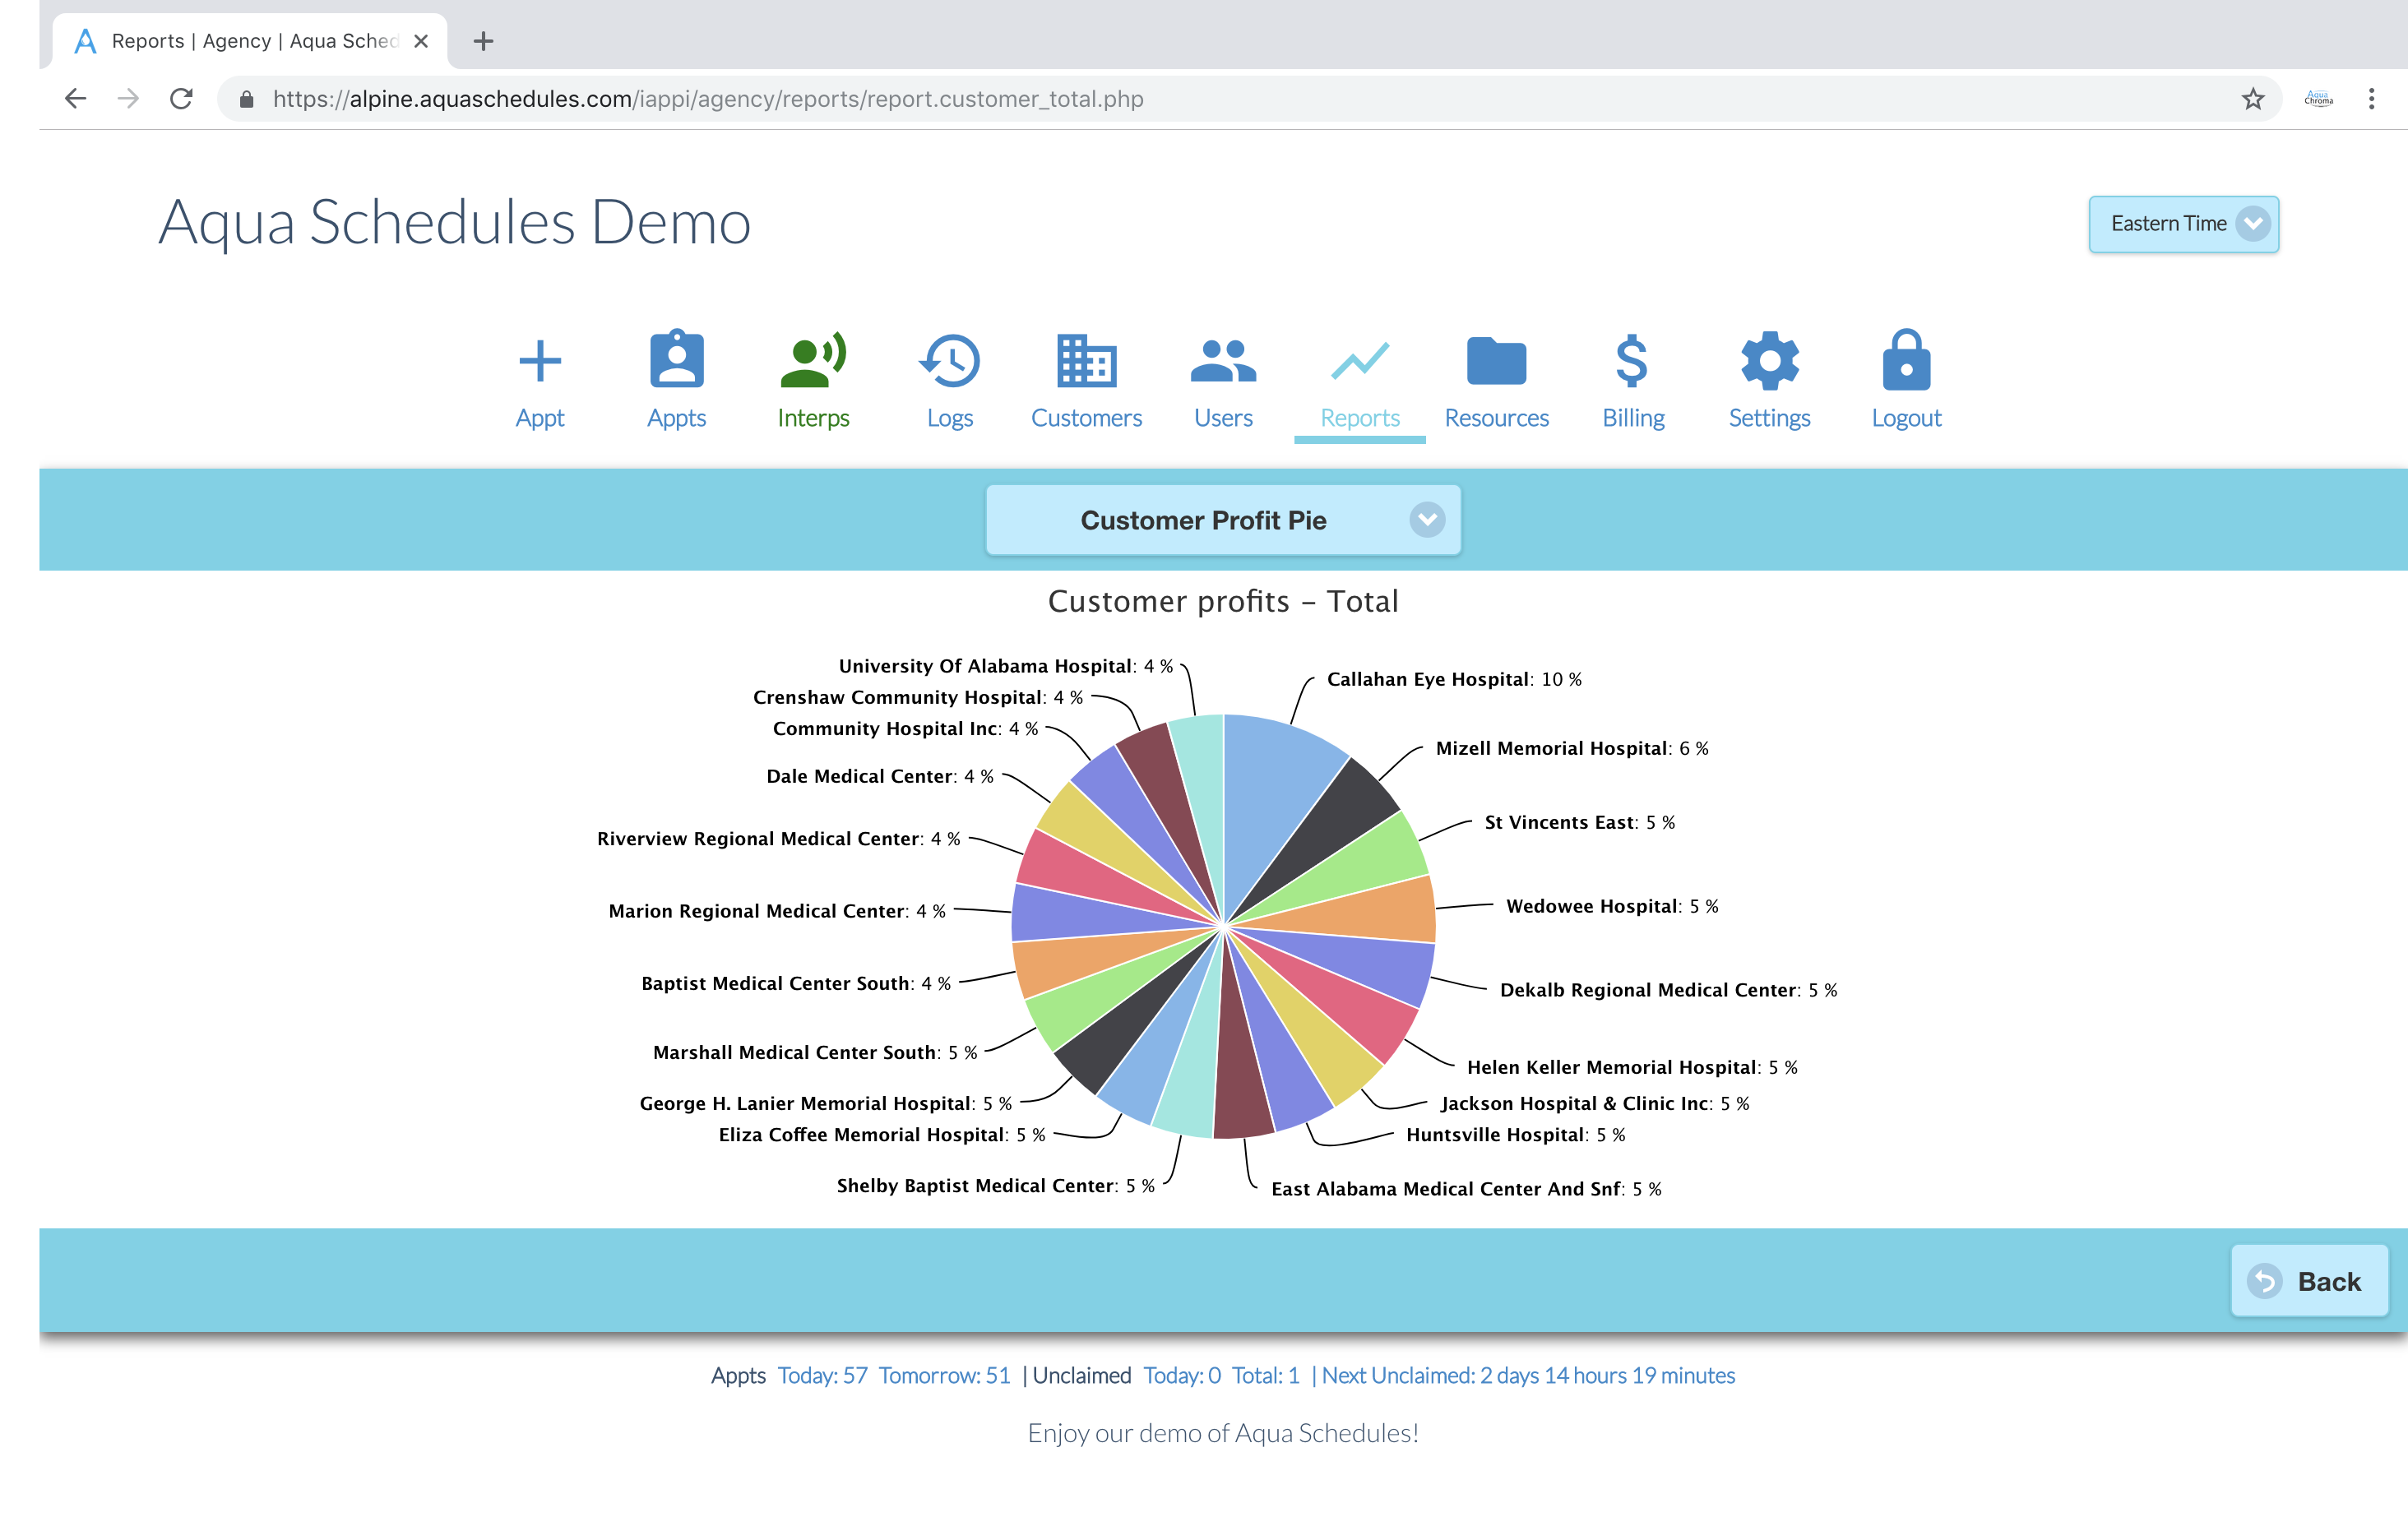
Pie chart showing the overall distribution of appointments by language.
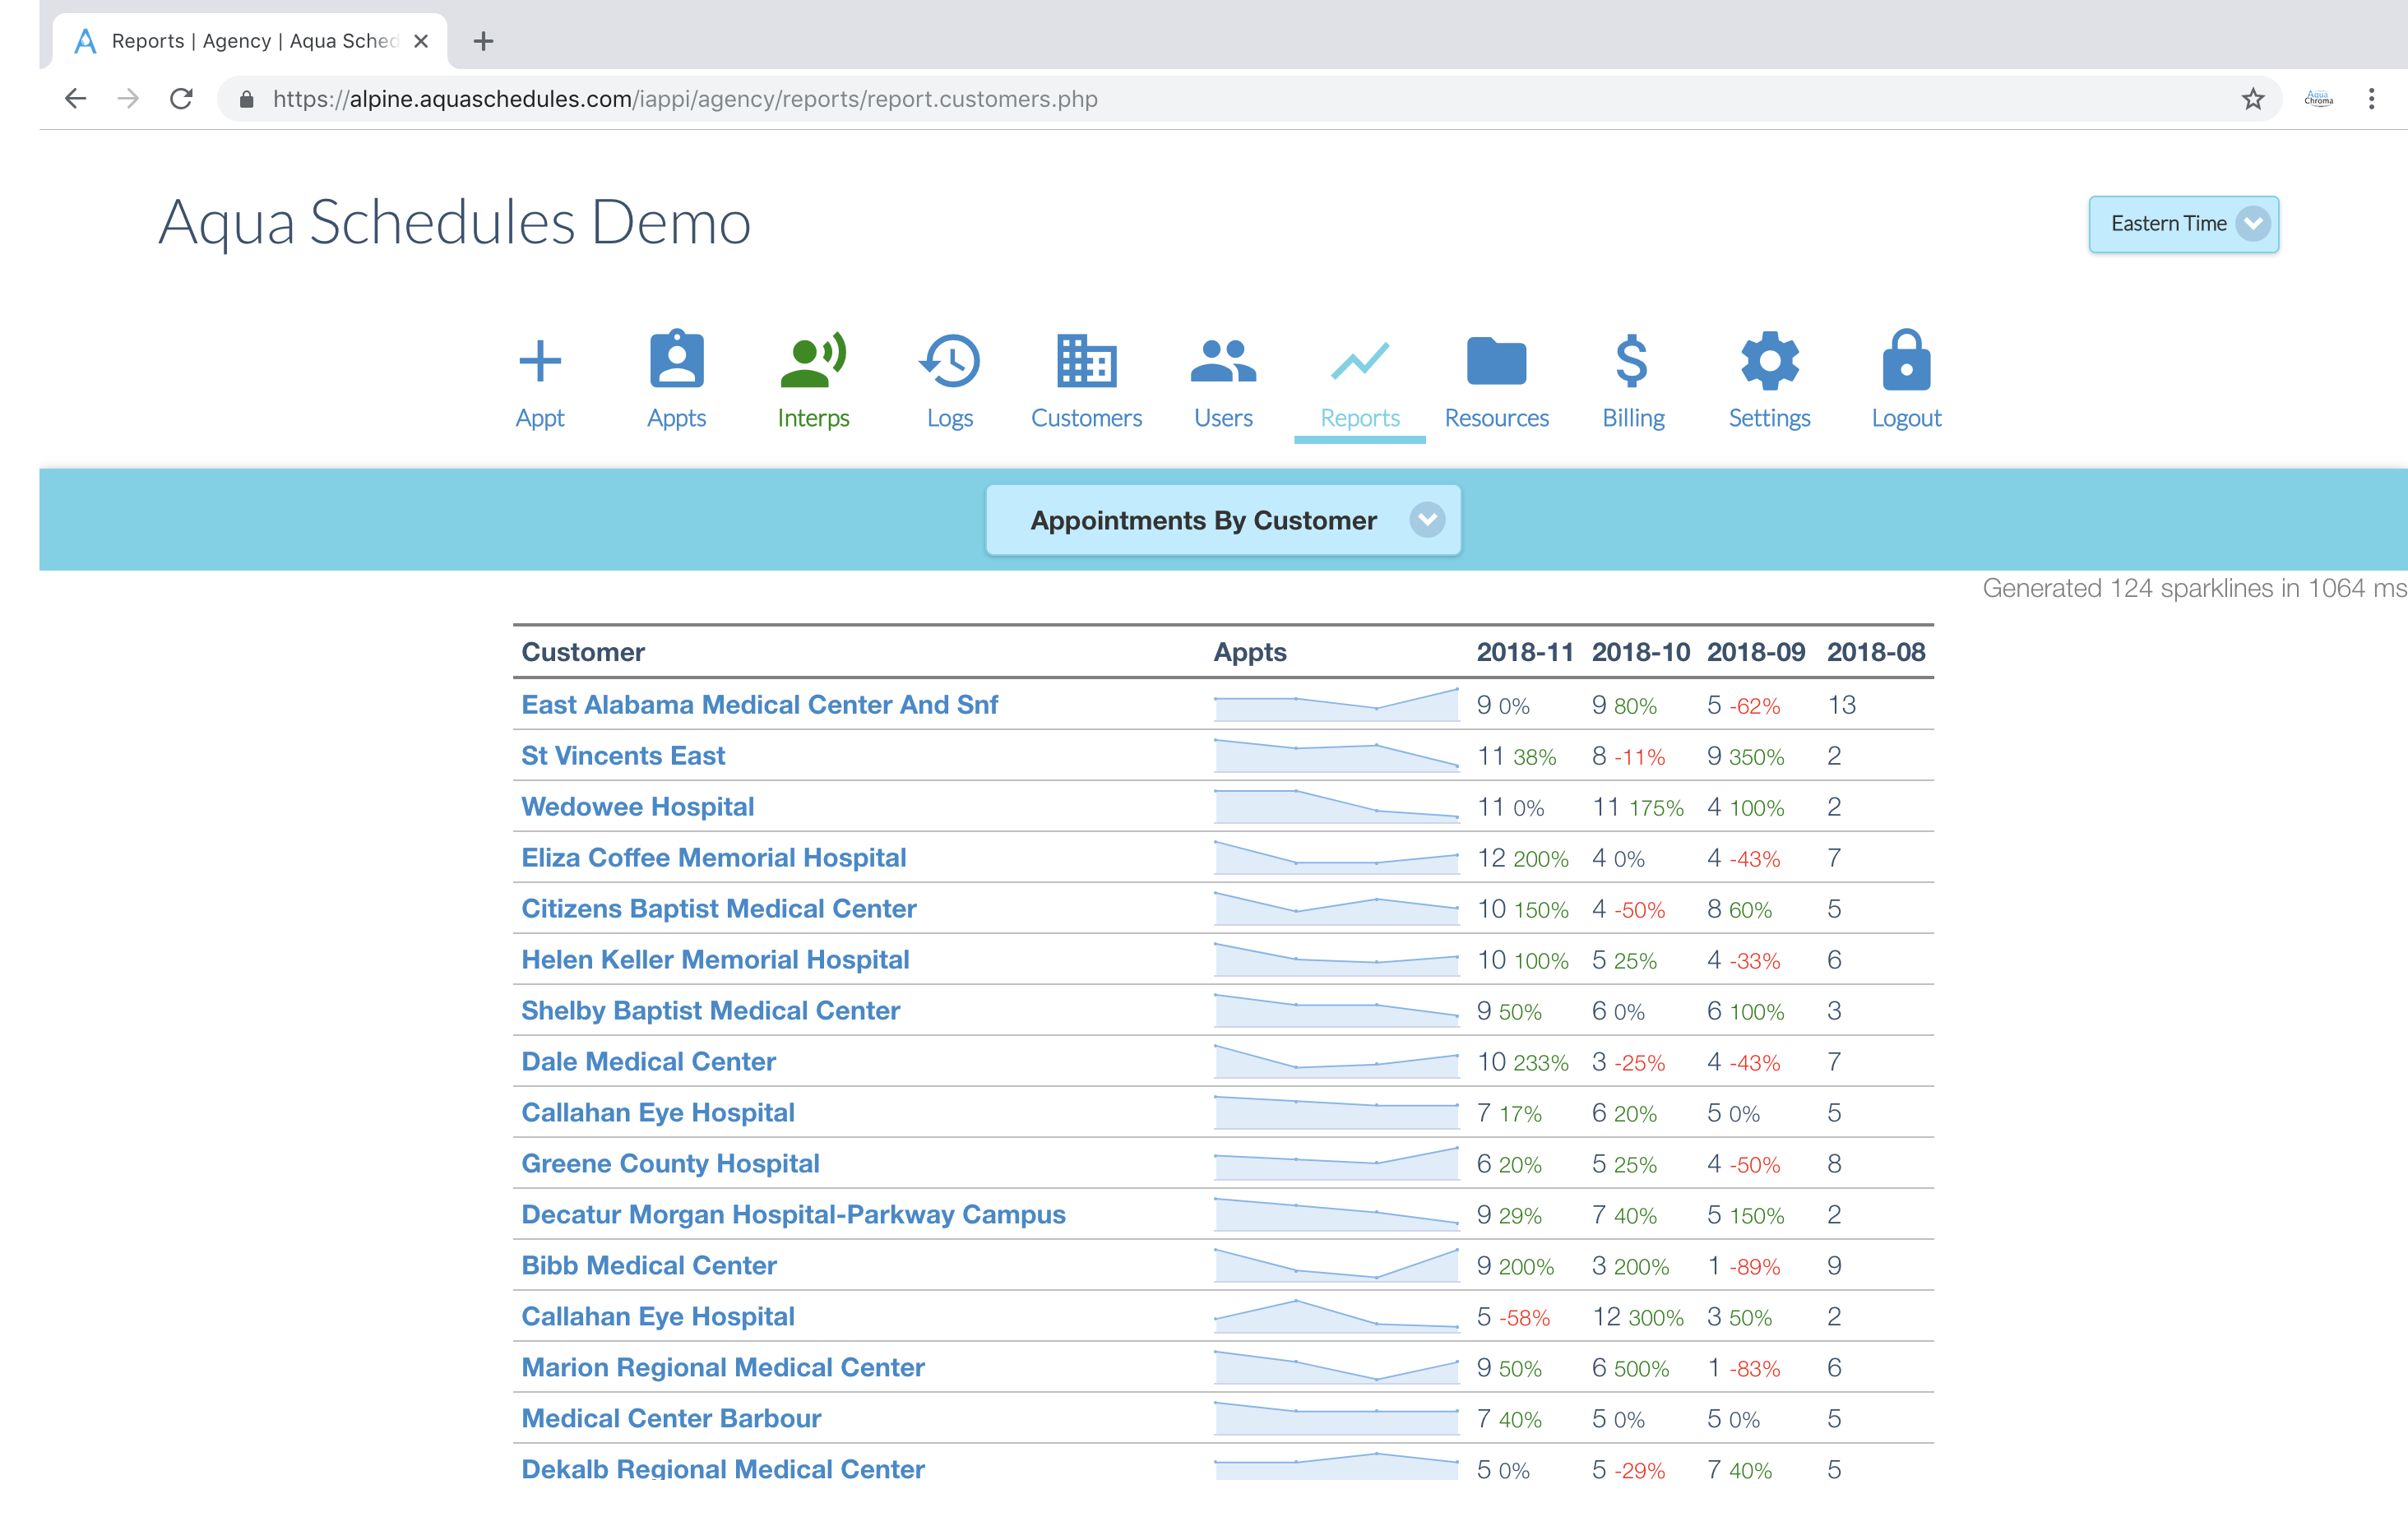
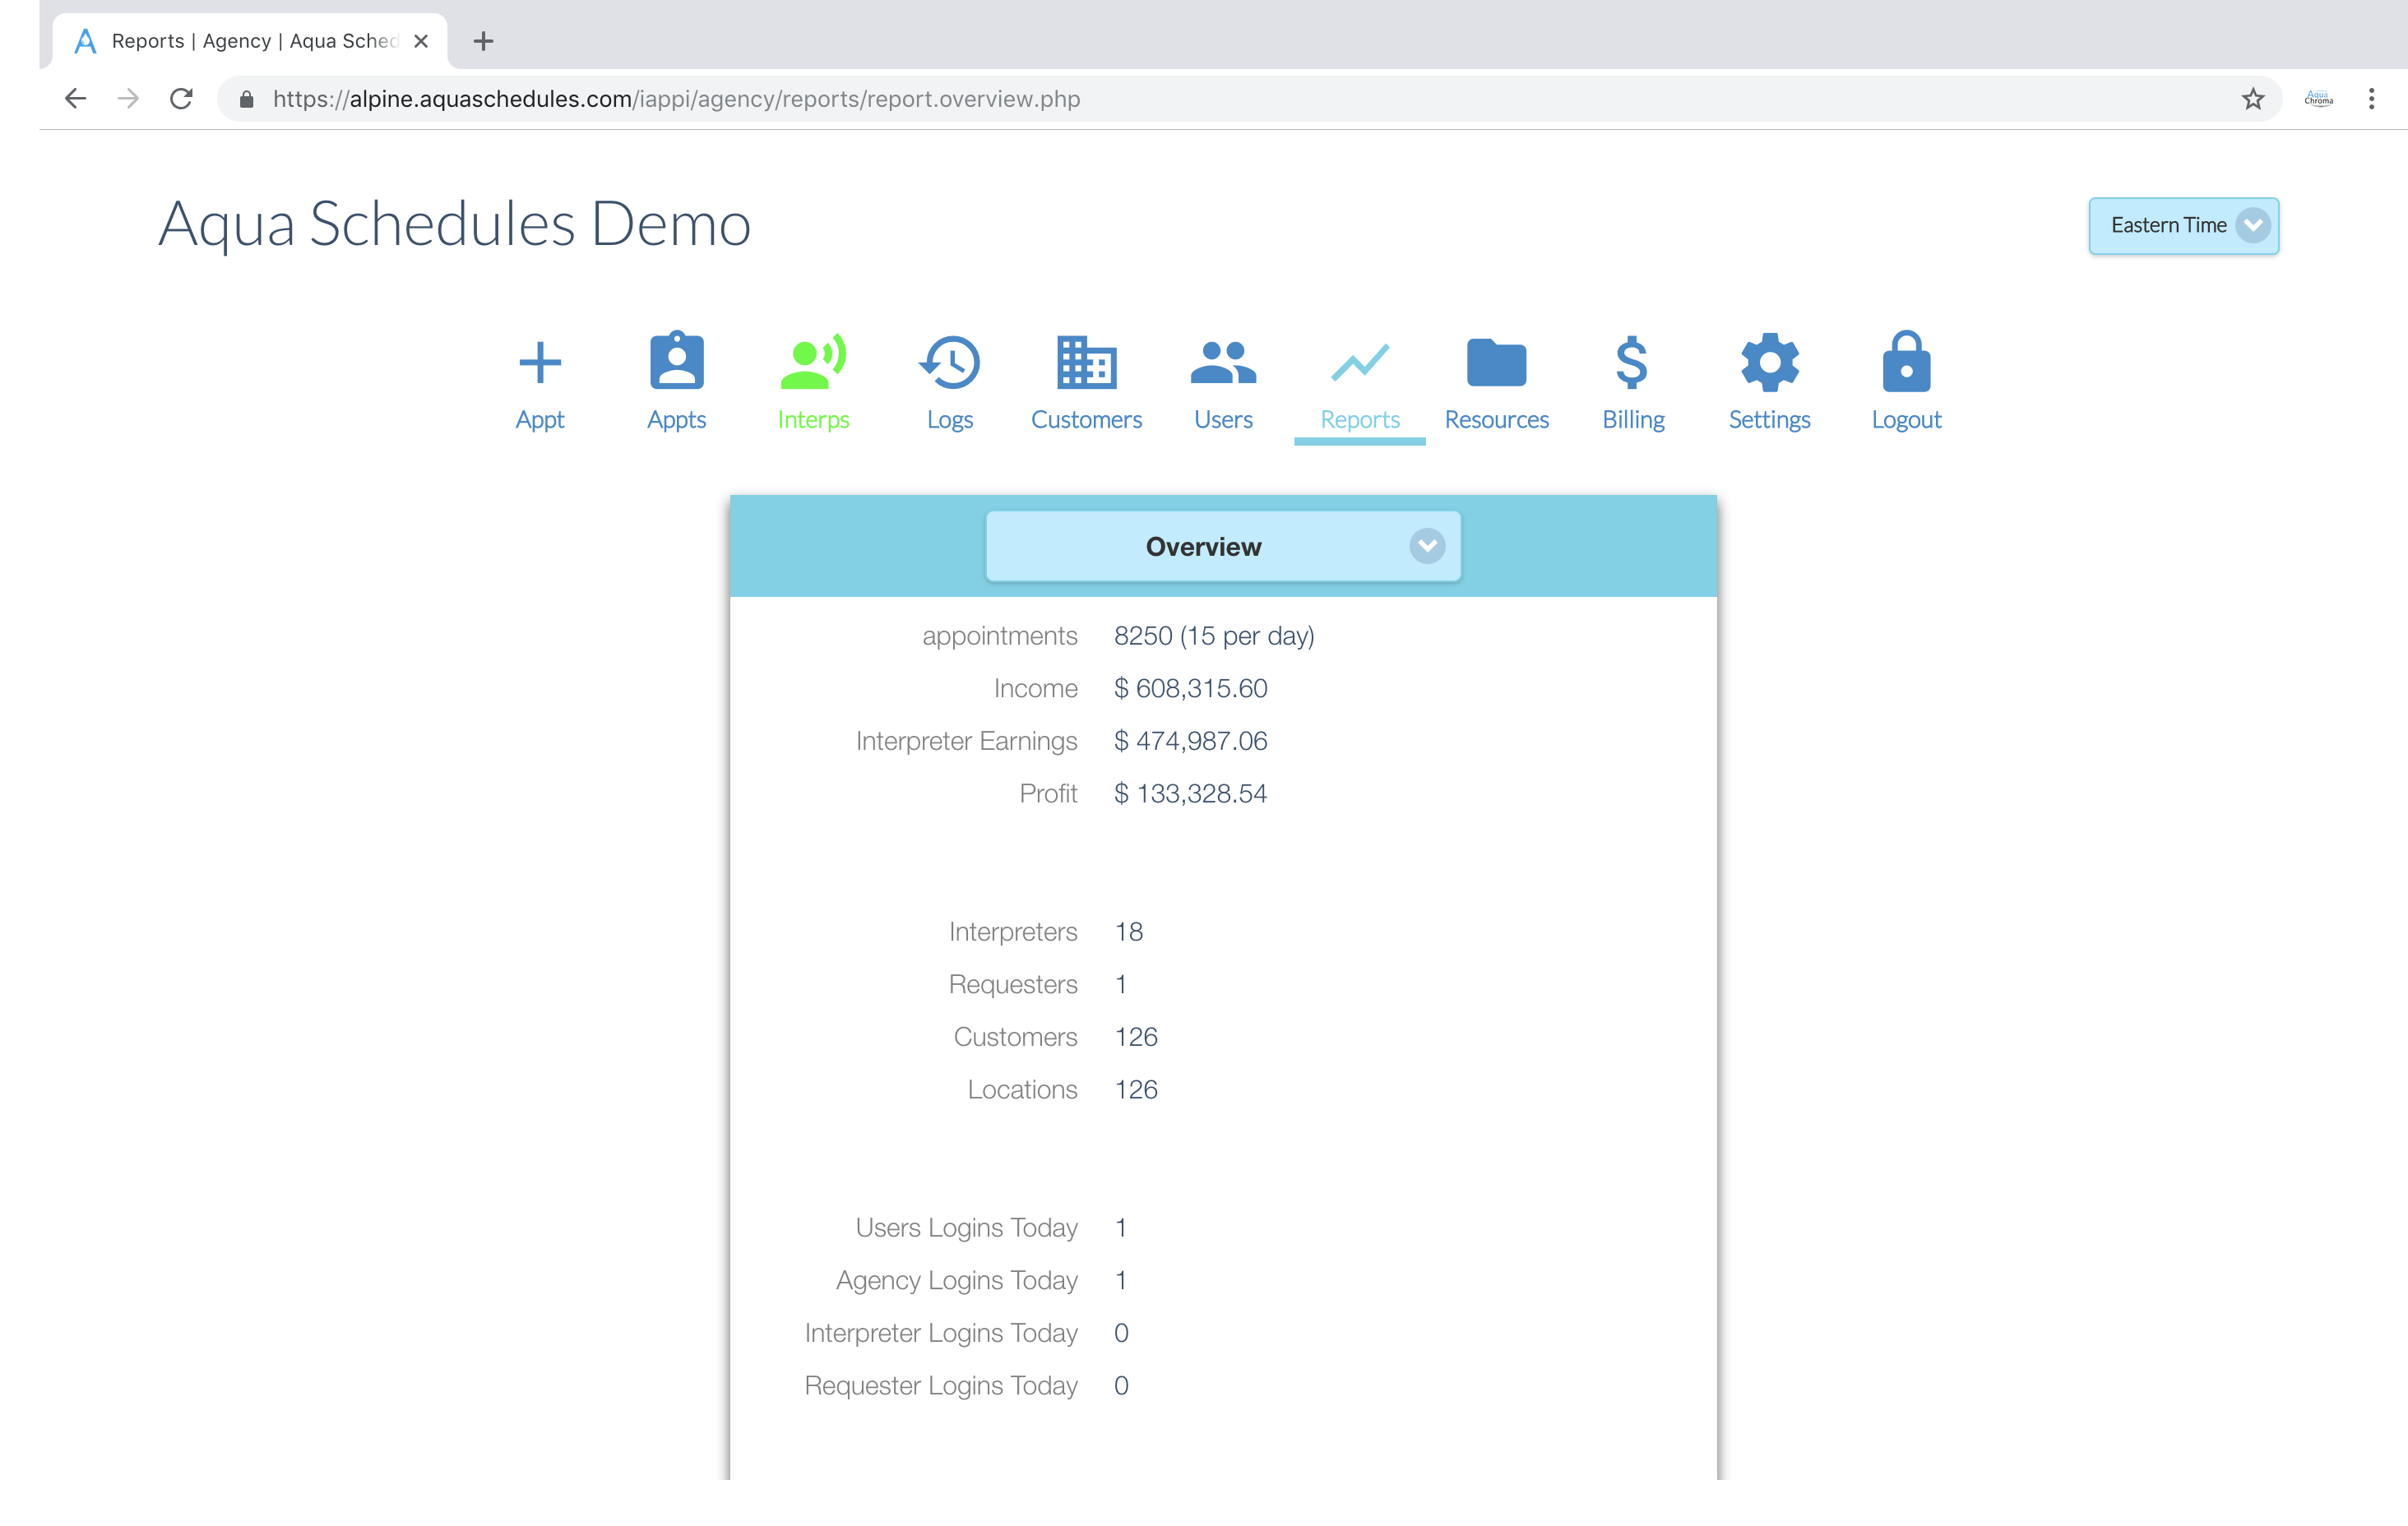
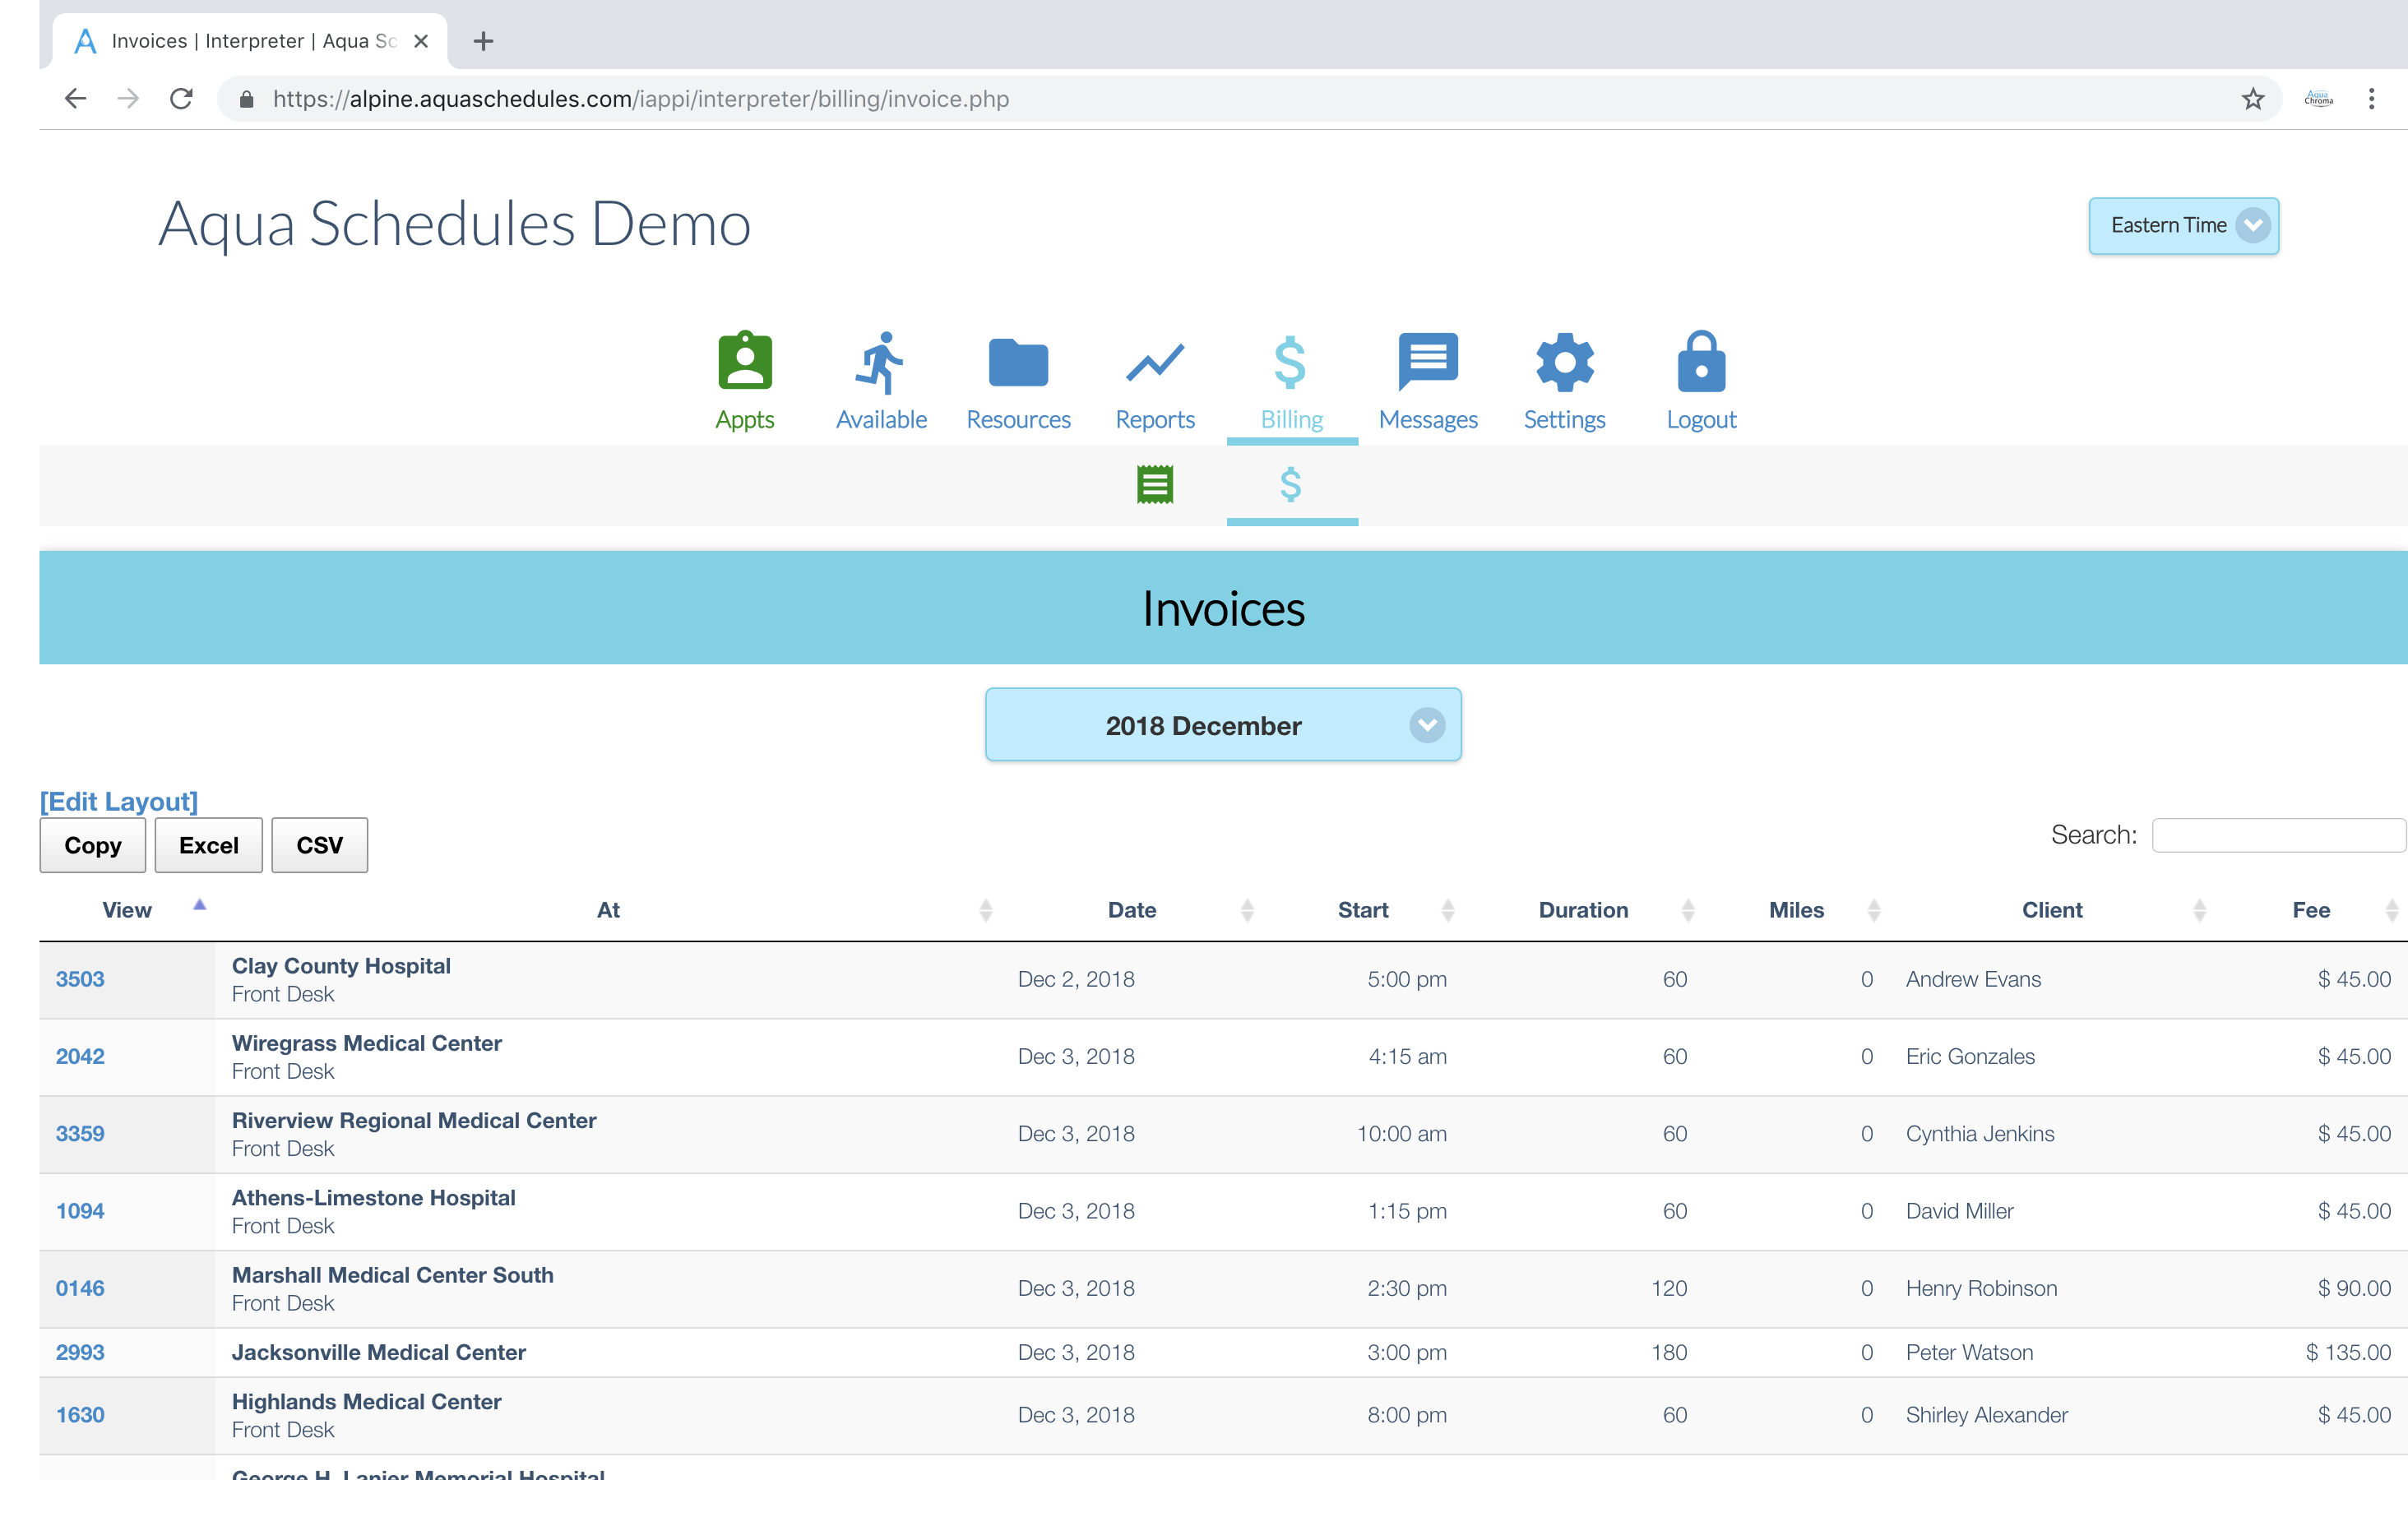
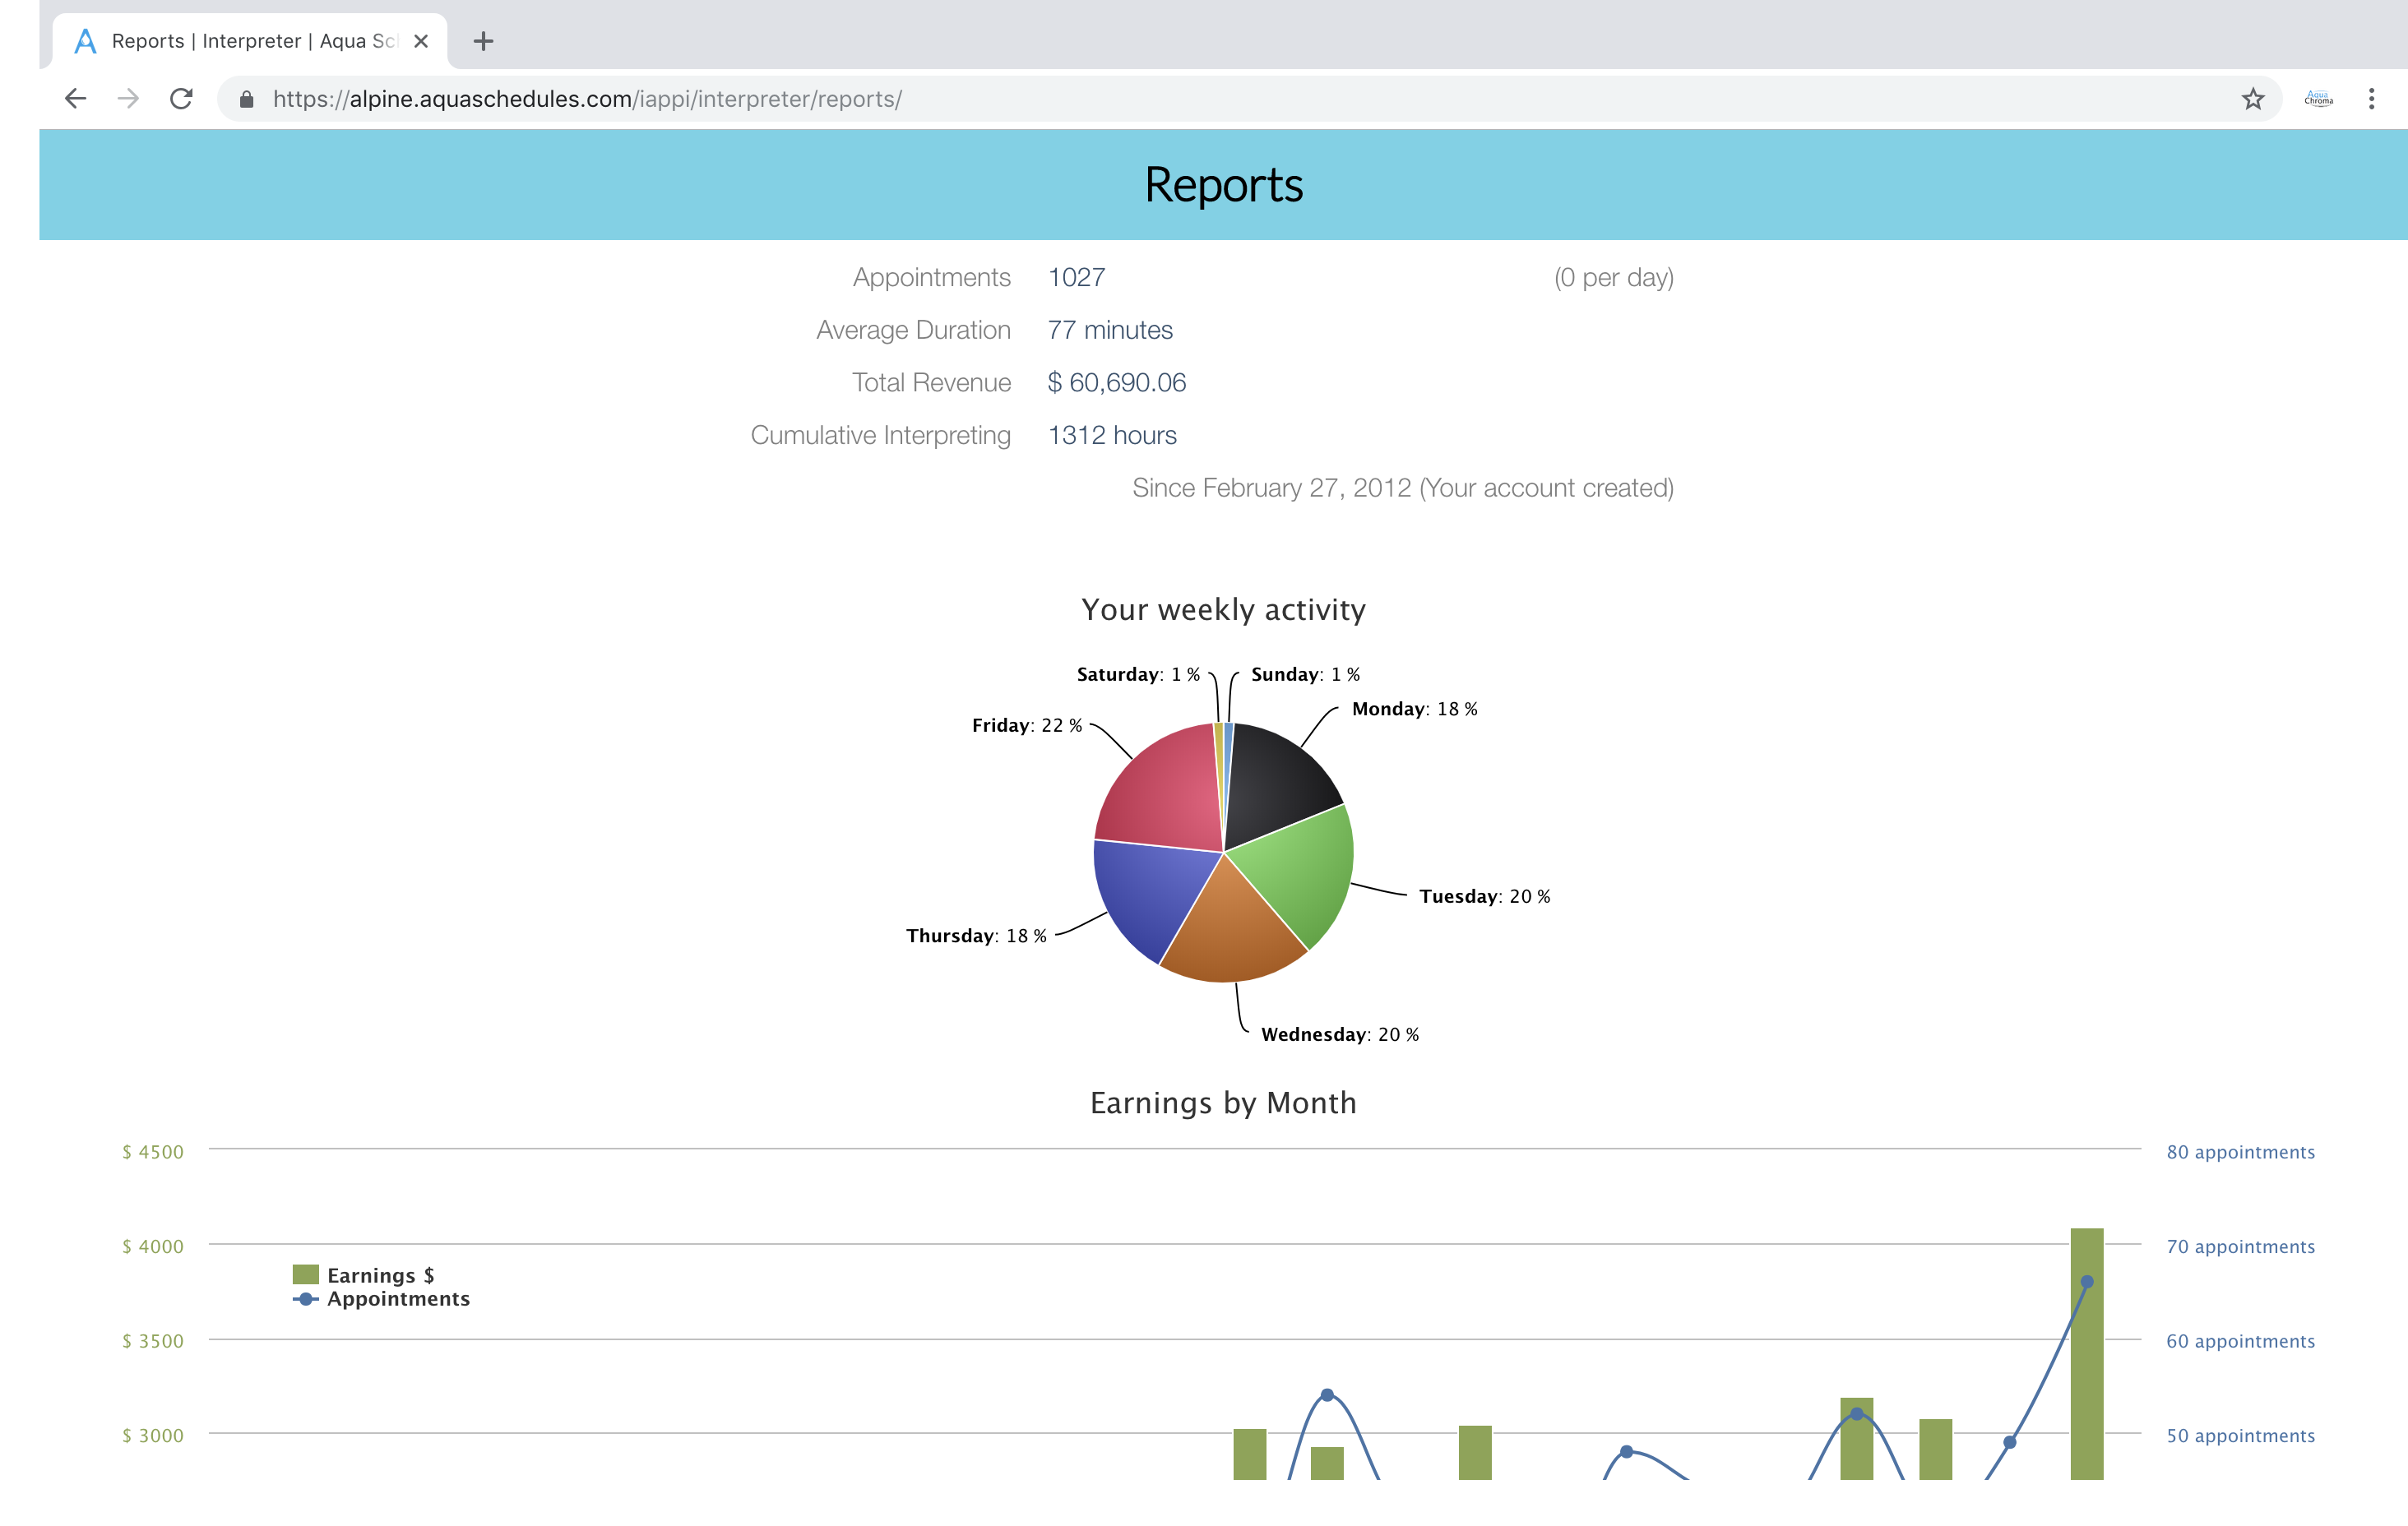
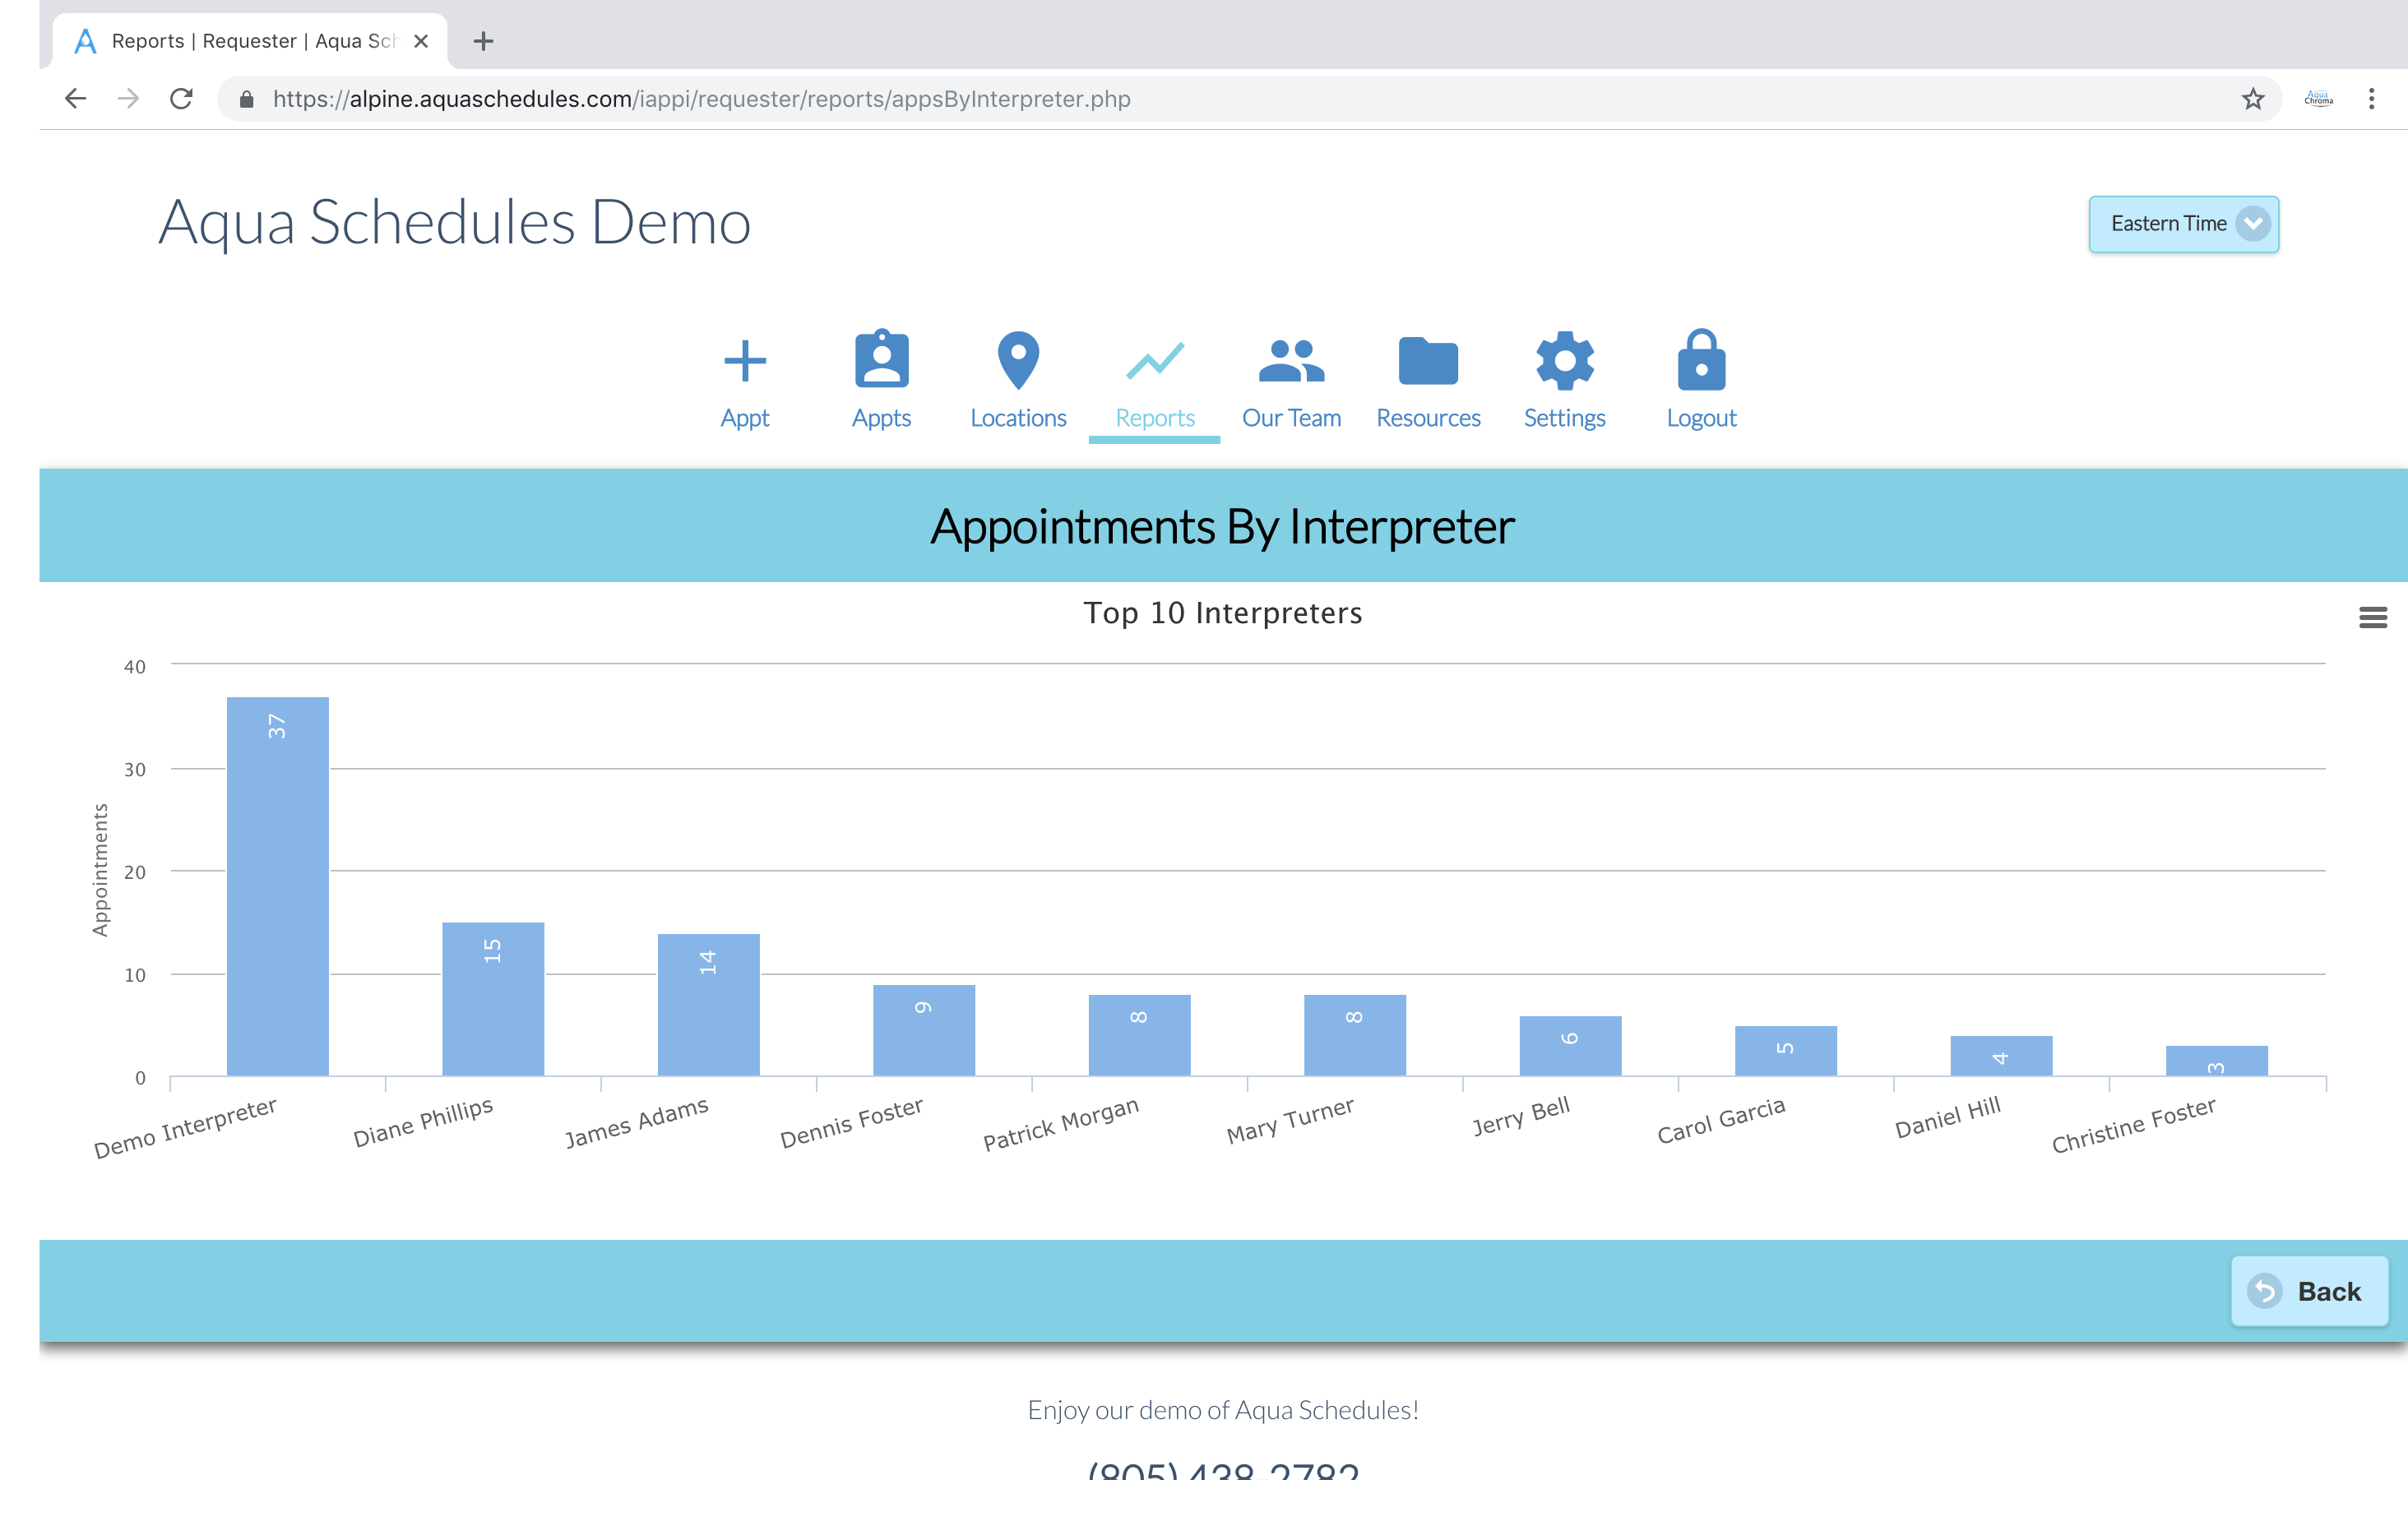
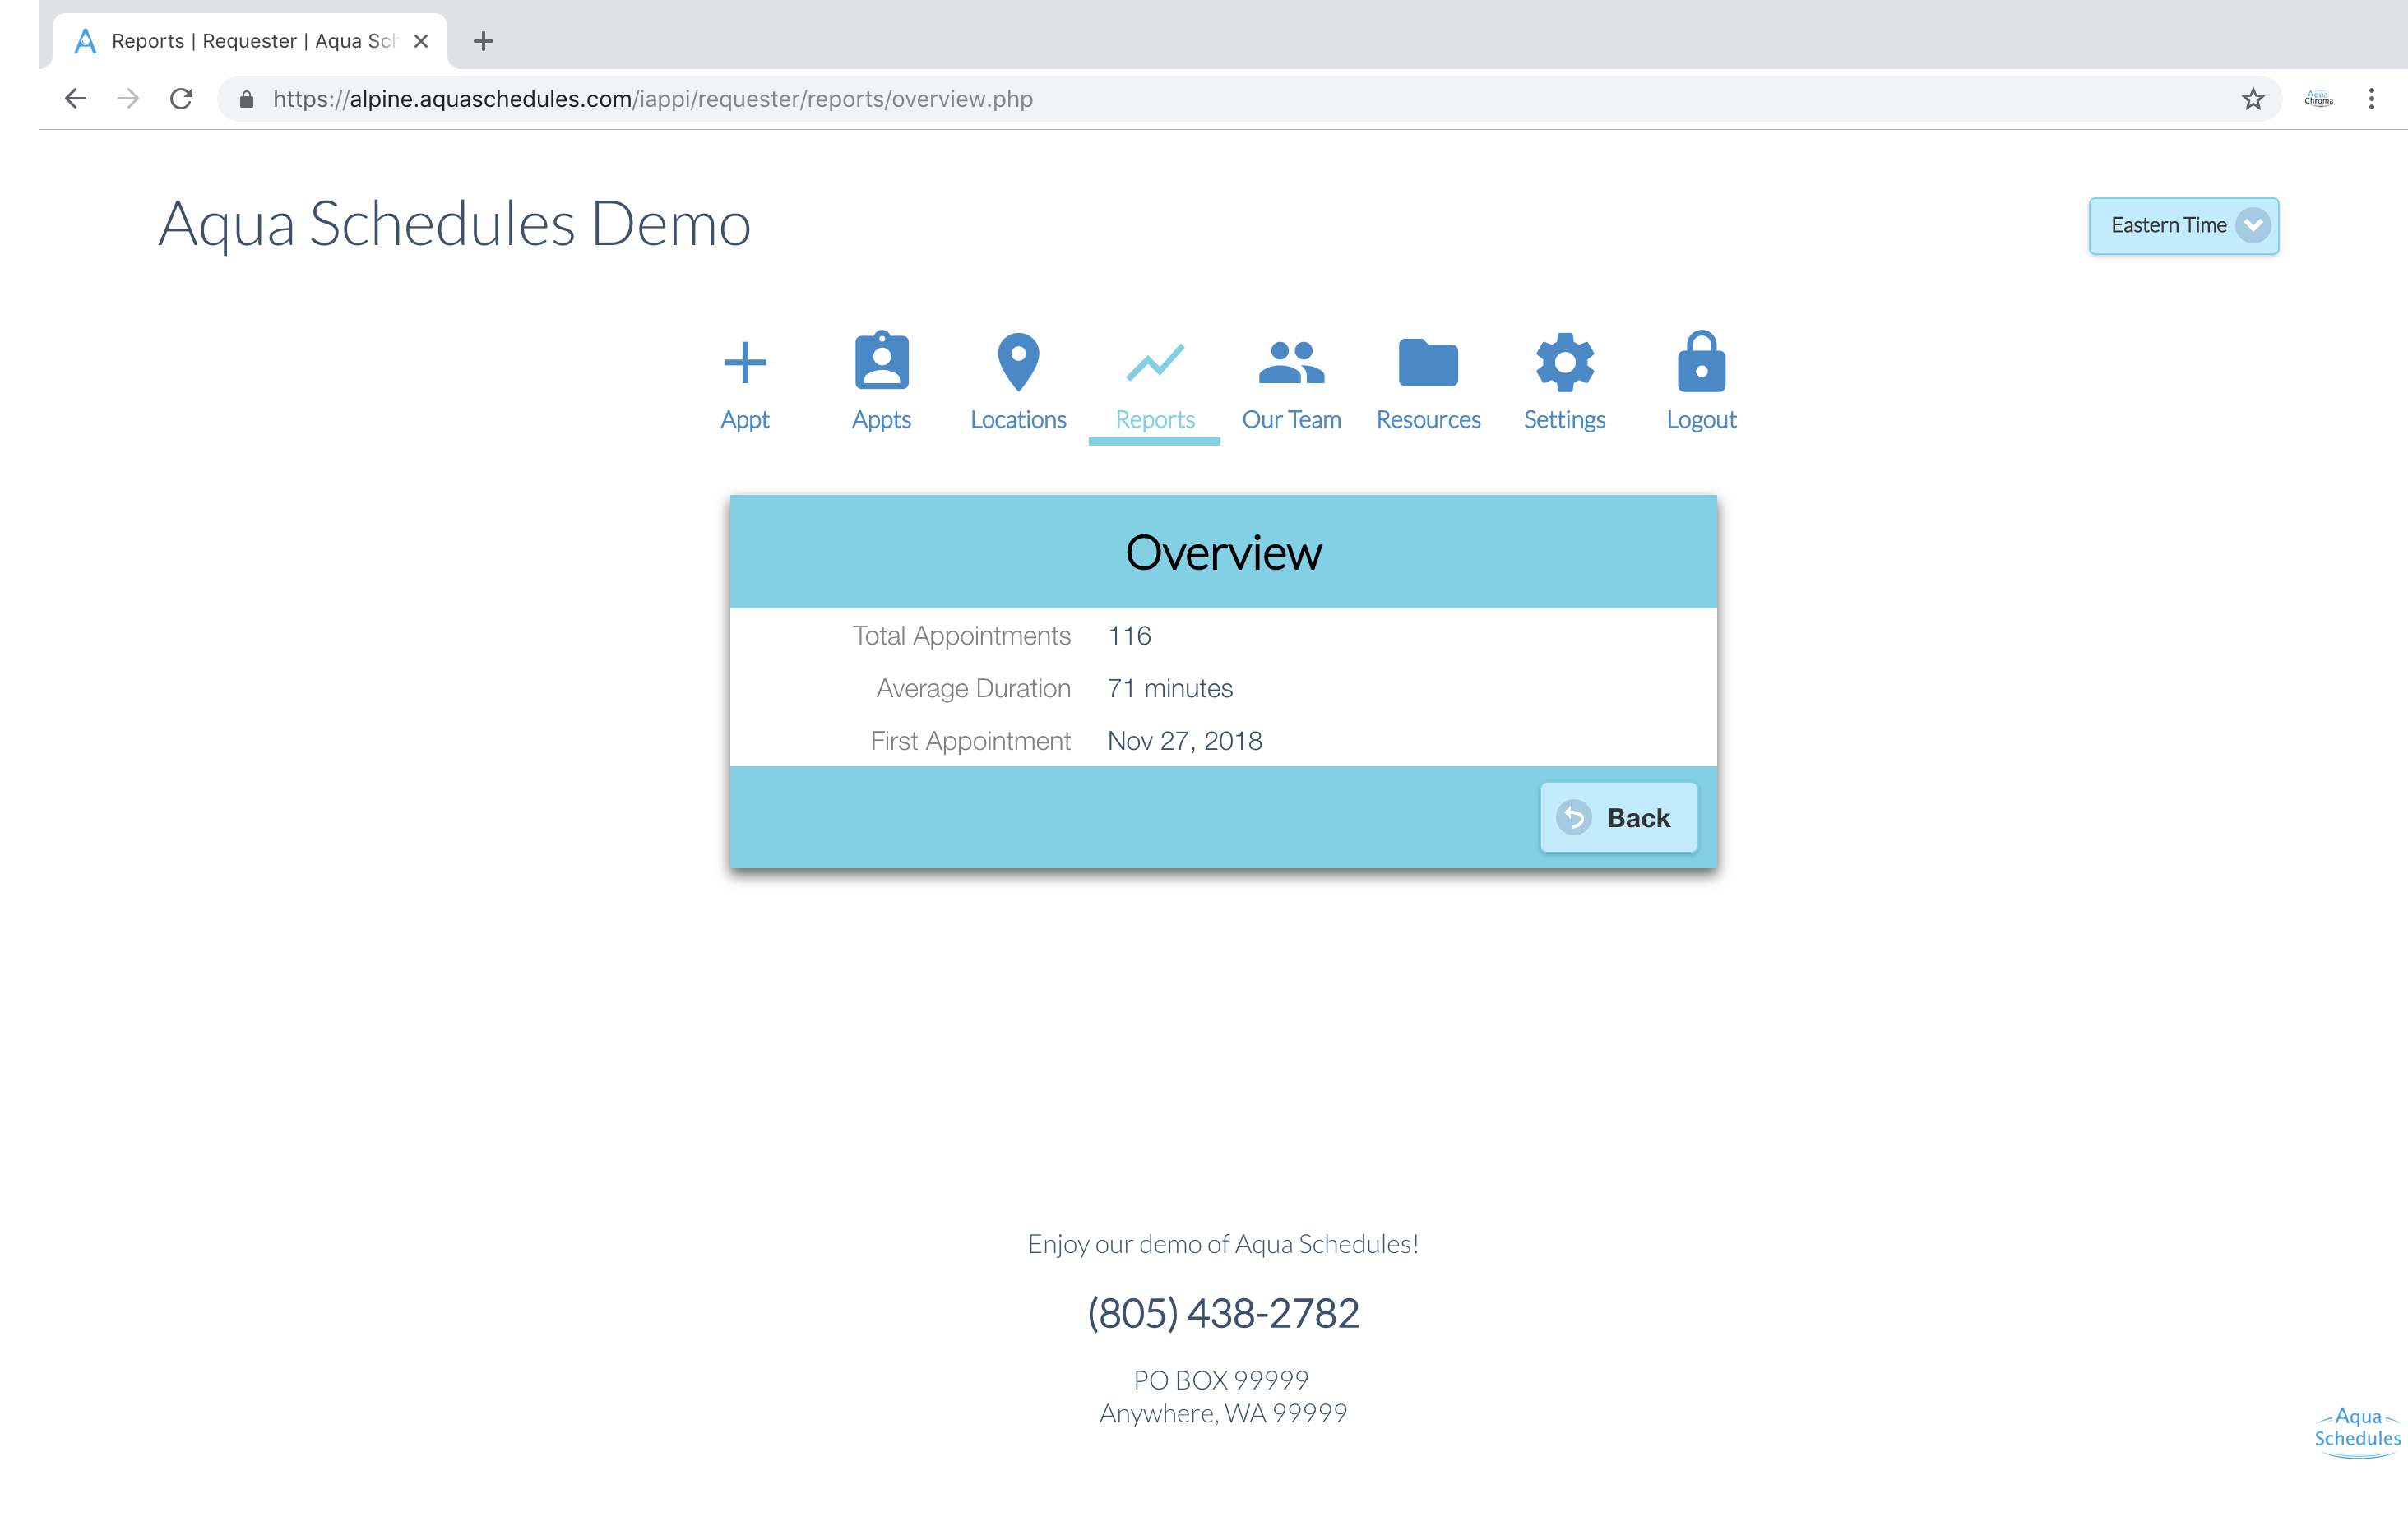
Provides statistics about the appointments scheduled with the agency.
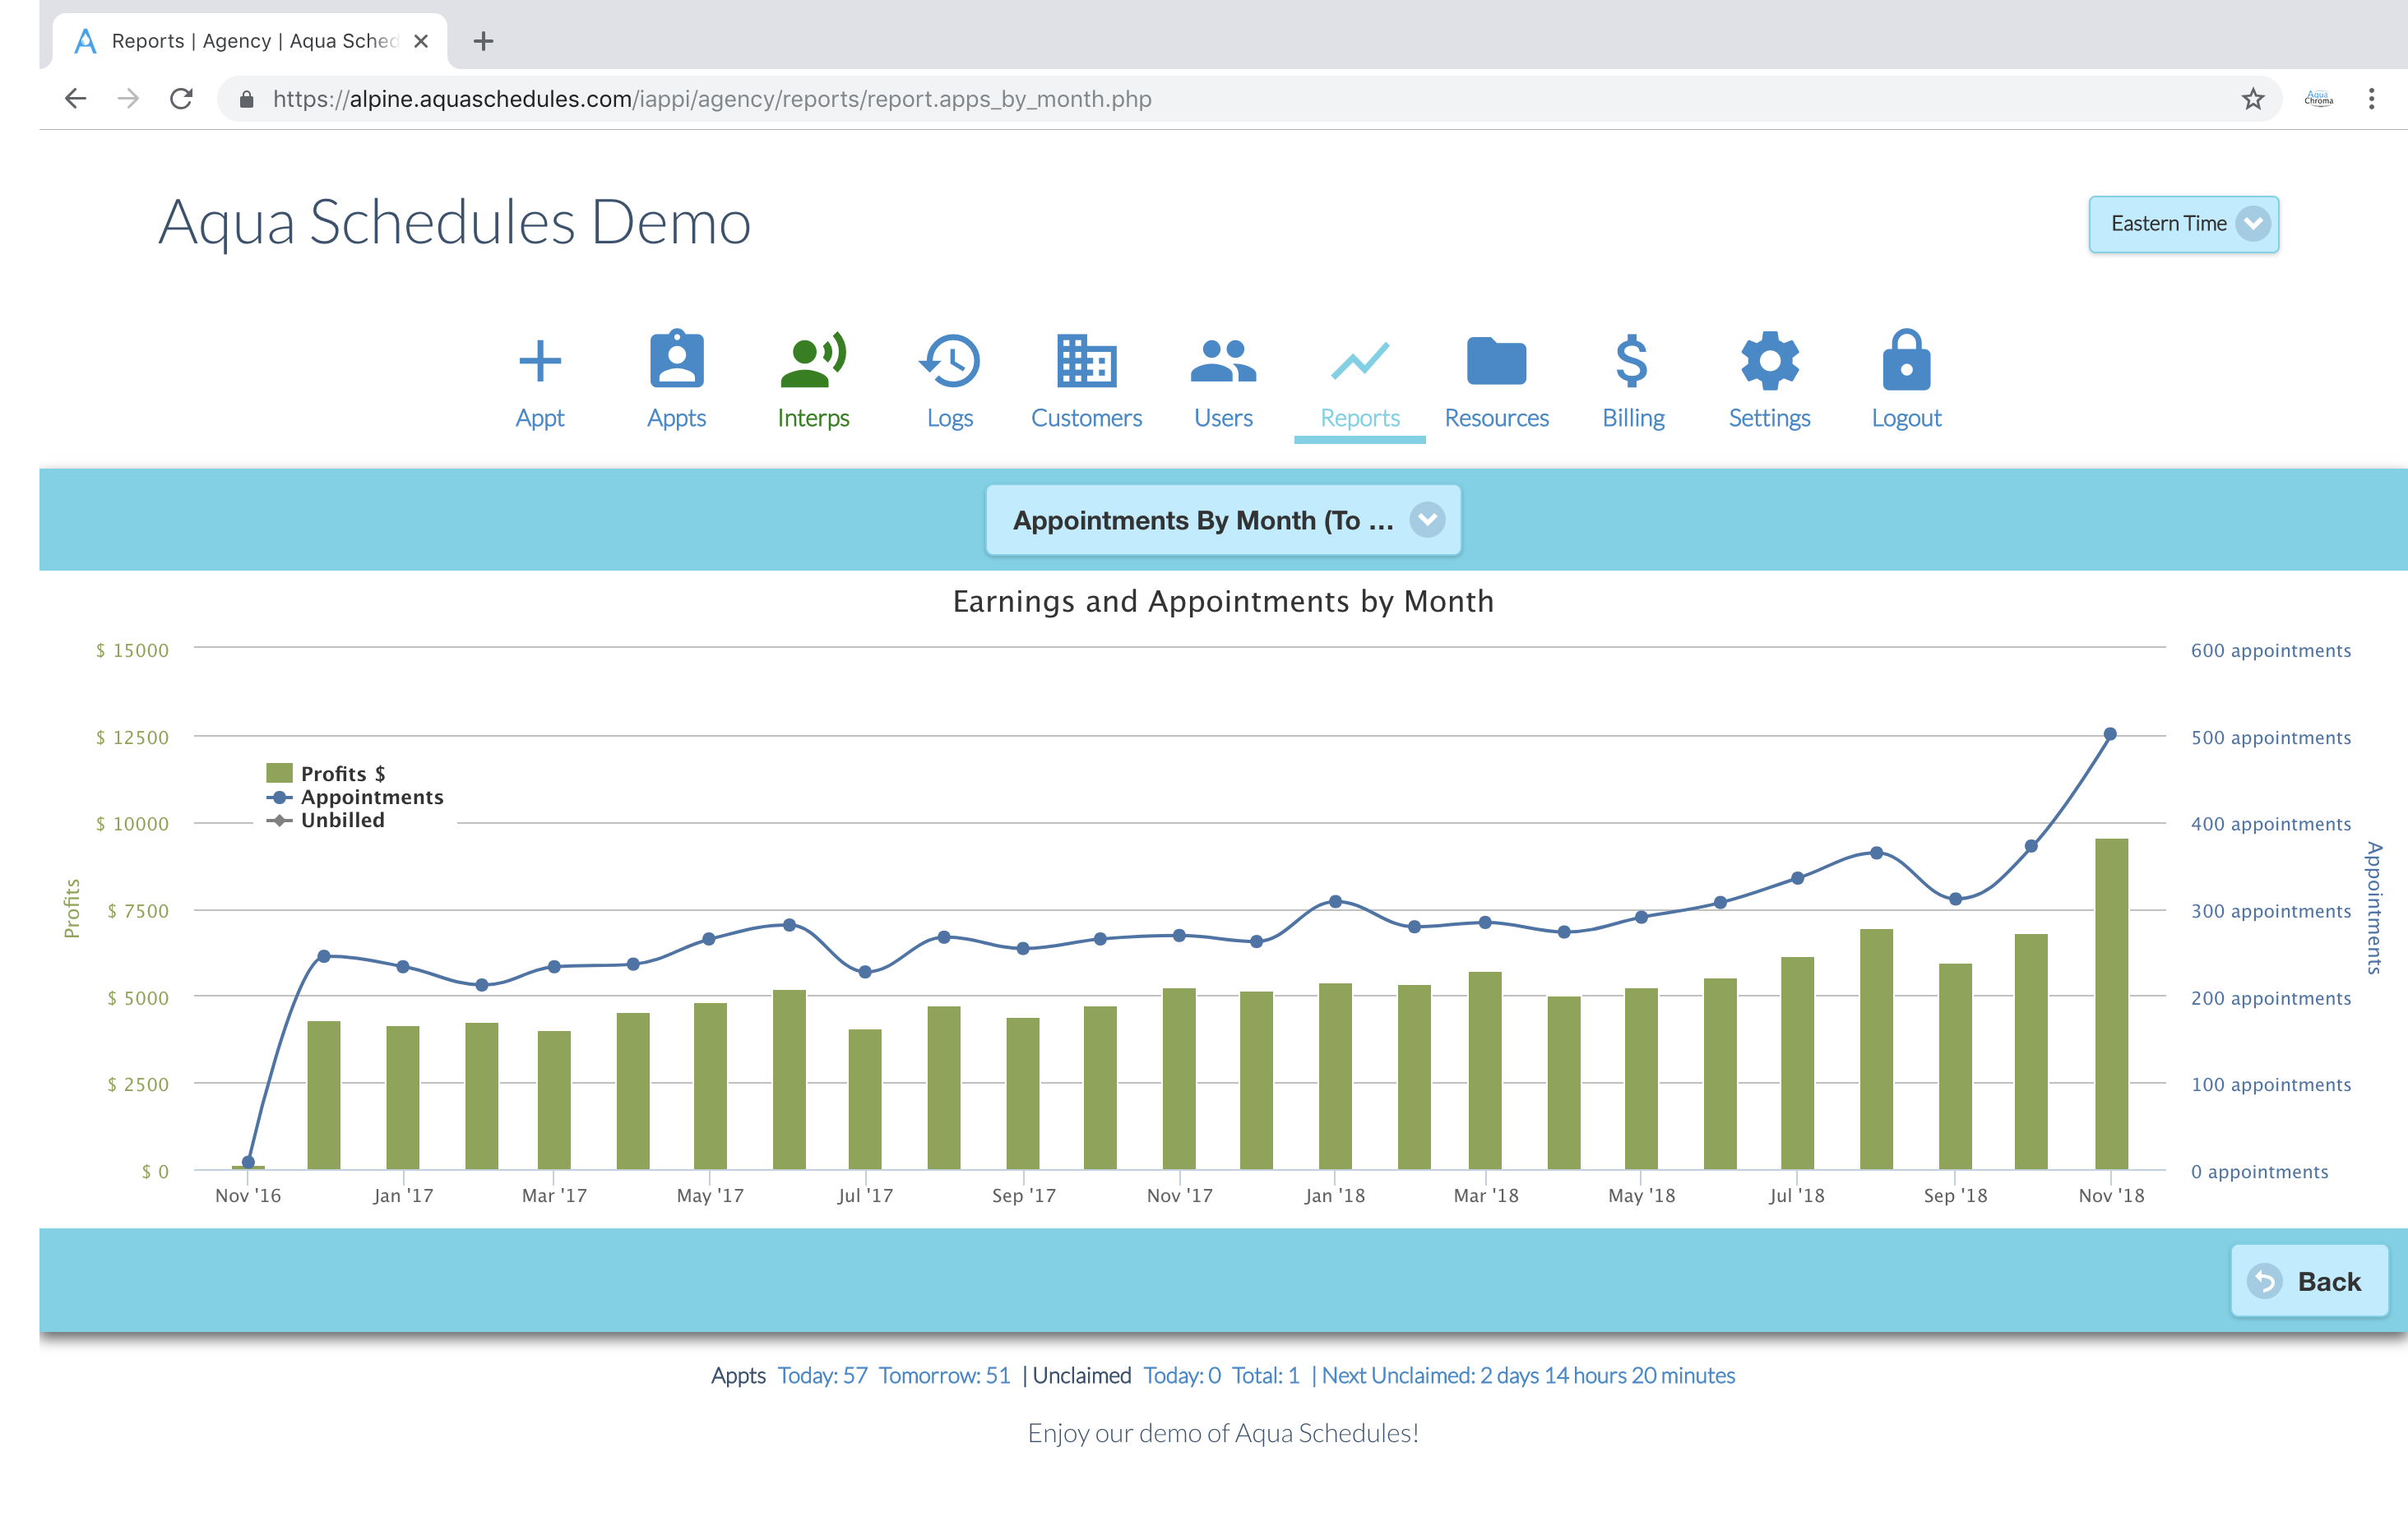
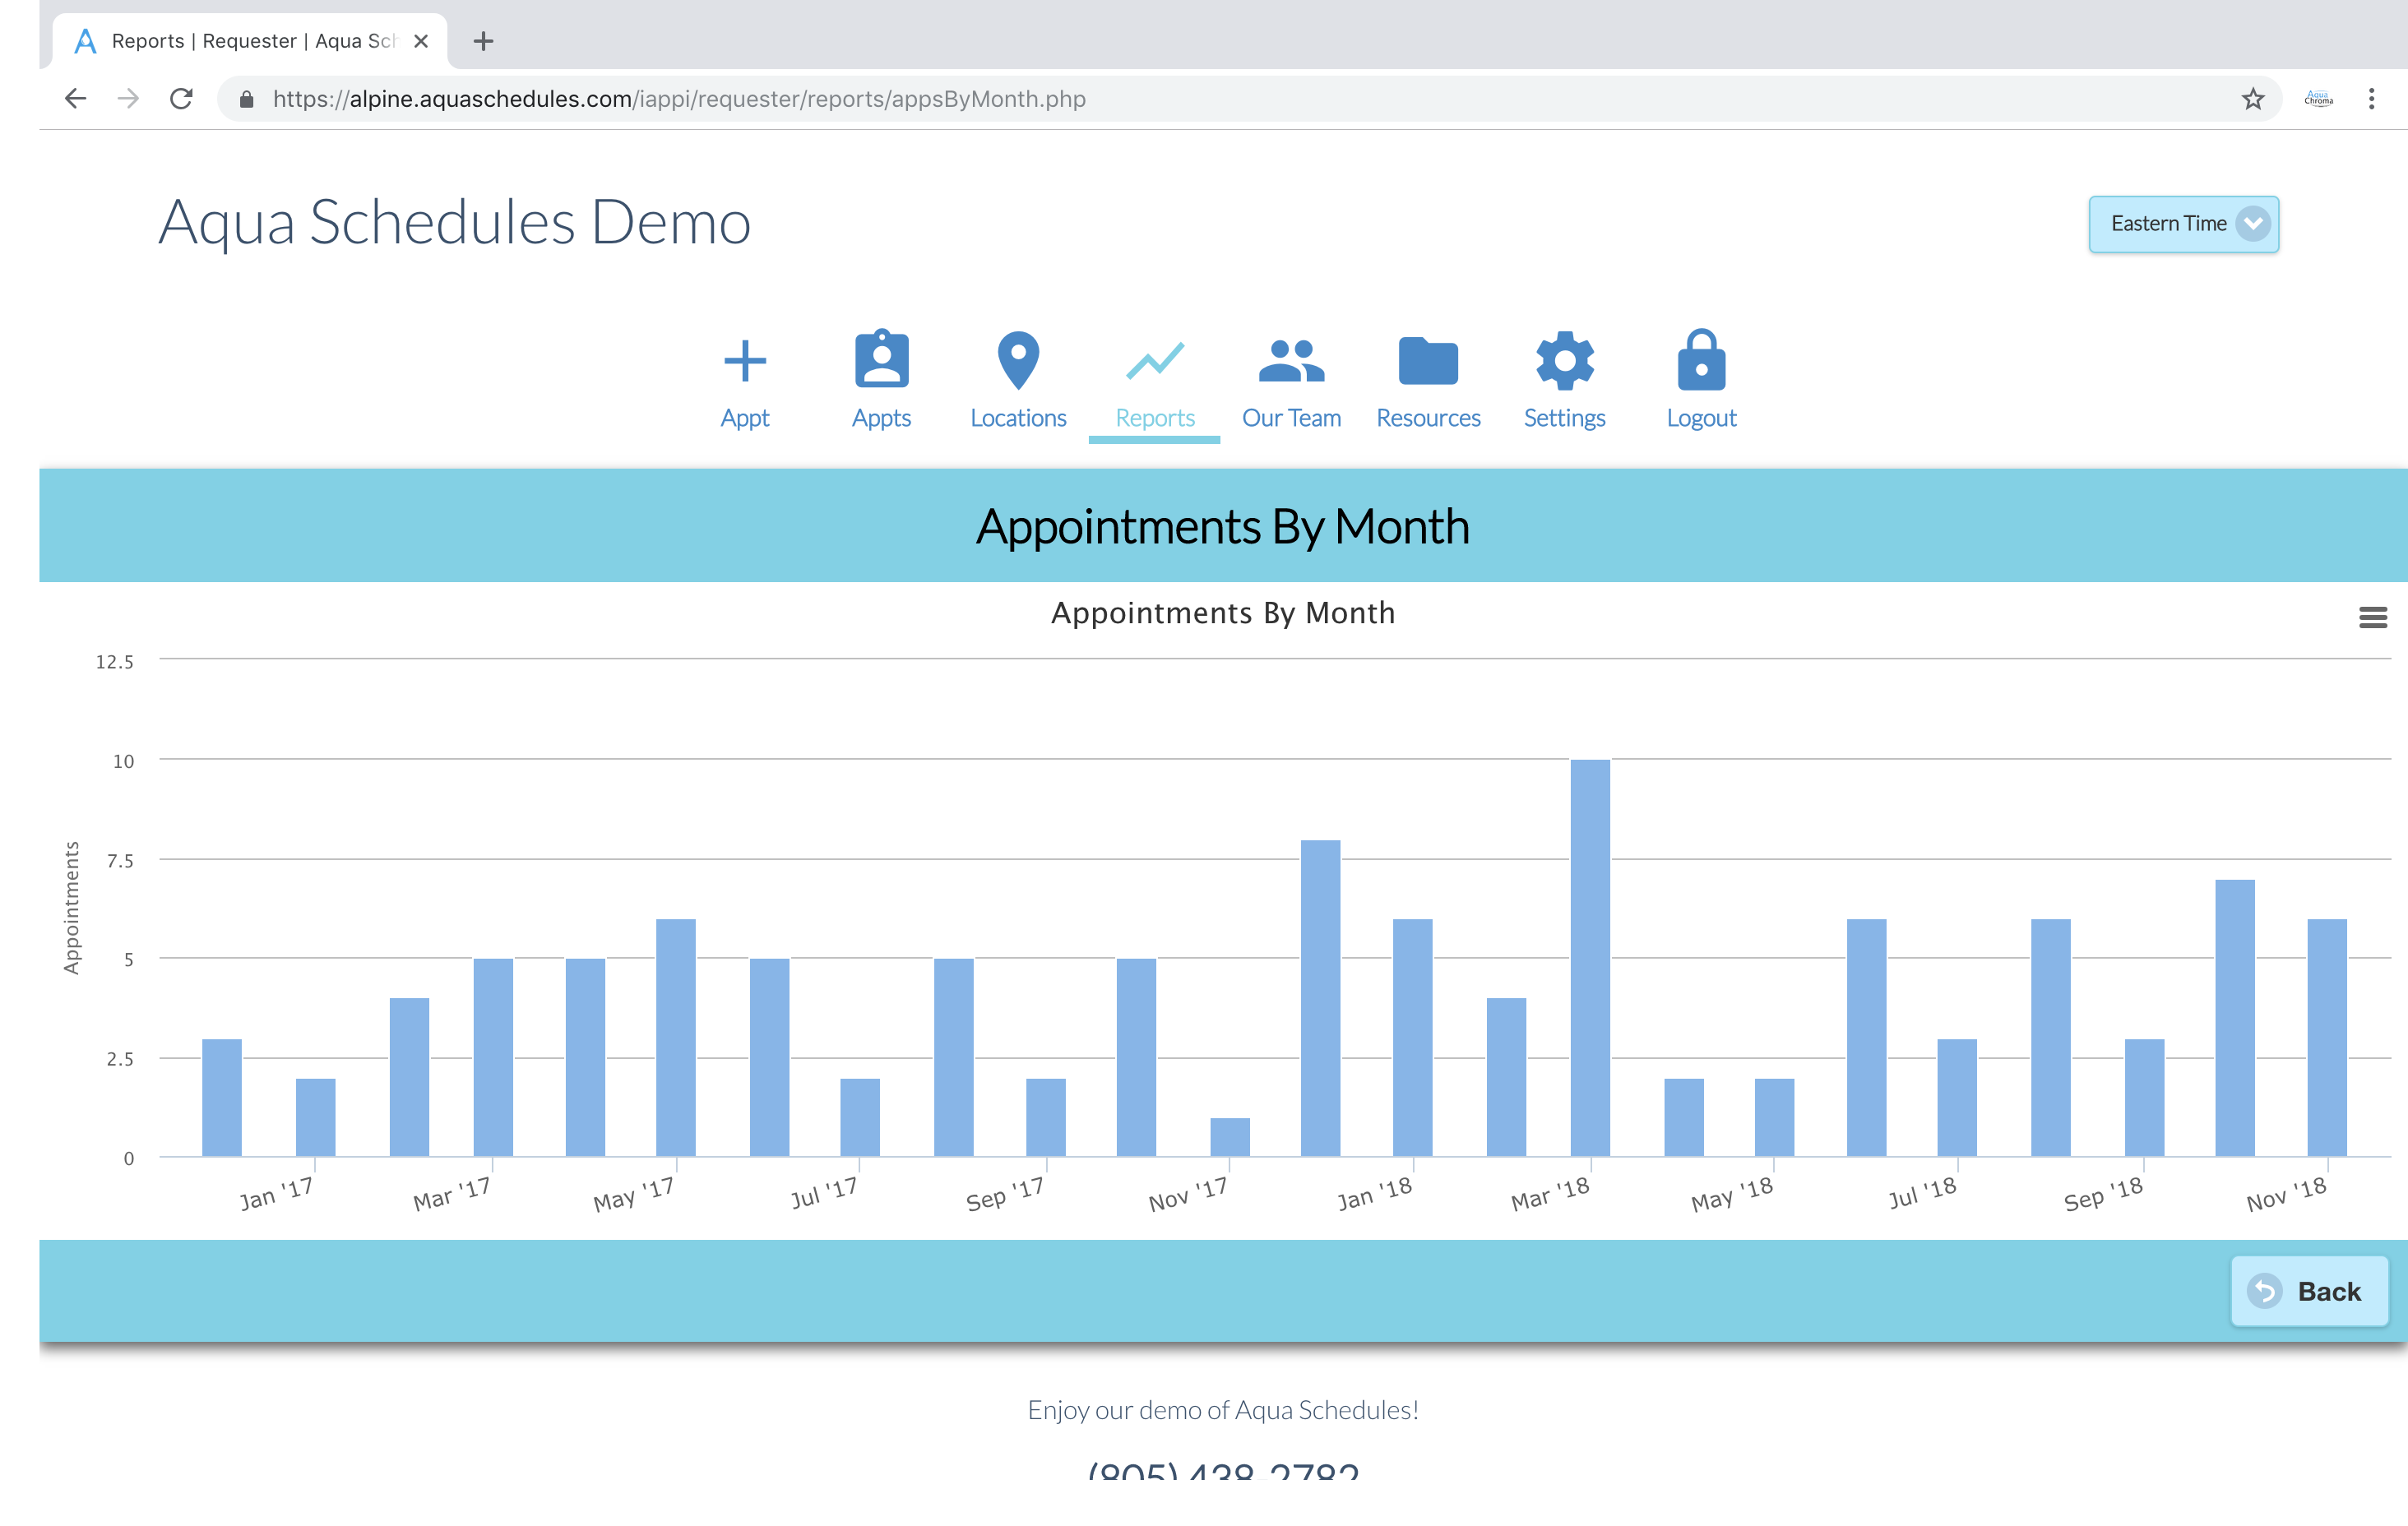
Bar graph showing total number of appointments by month.
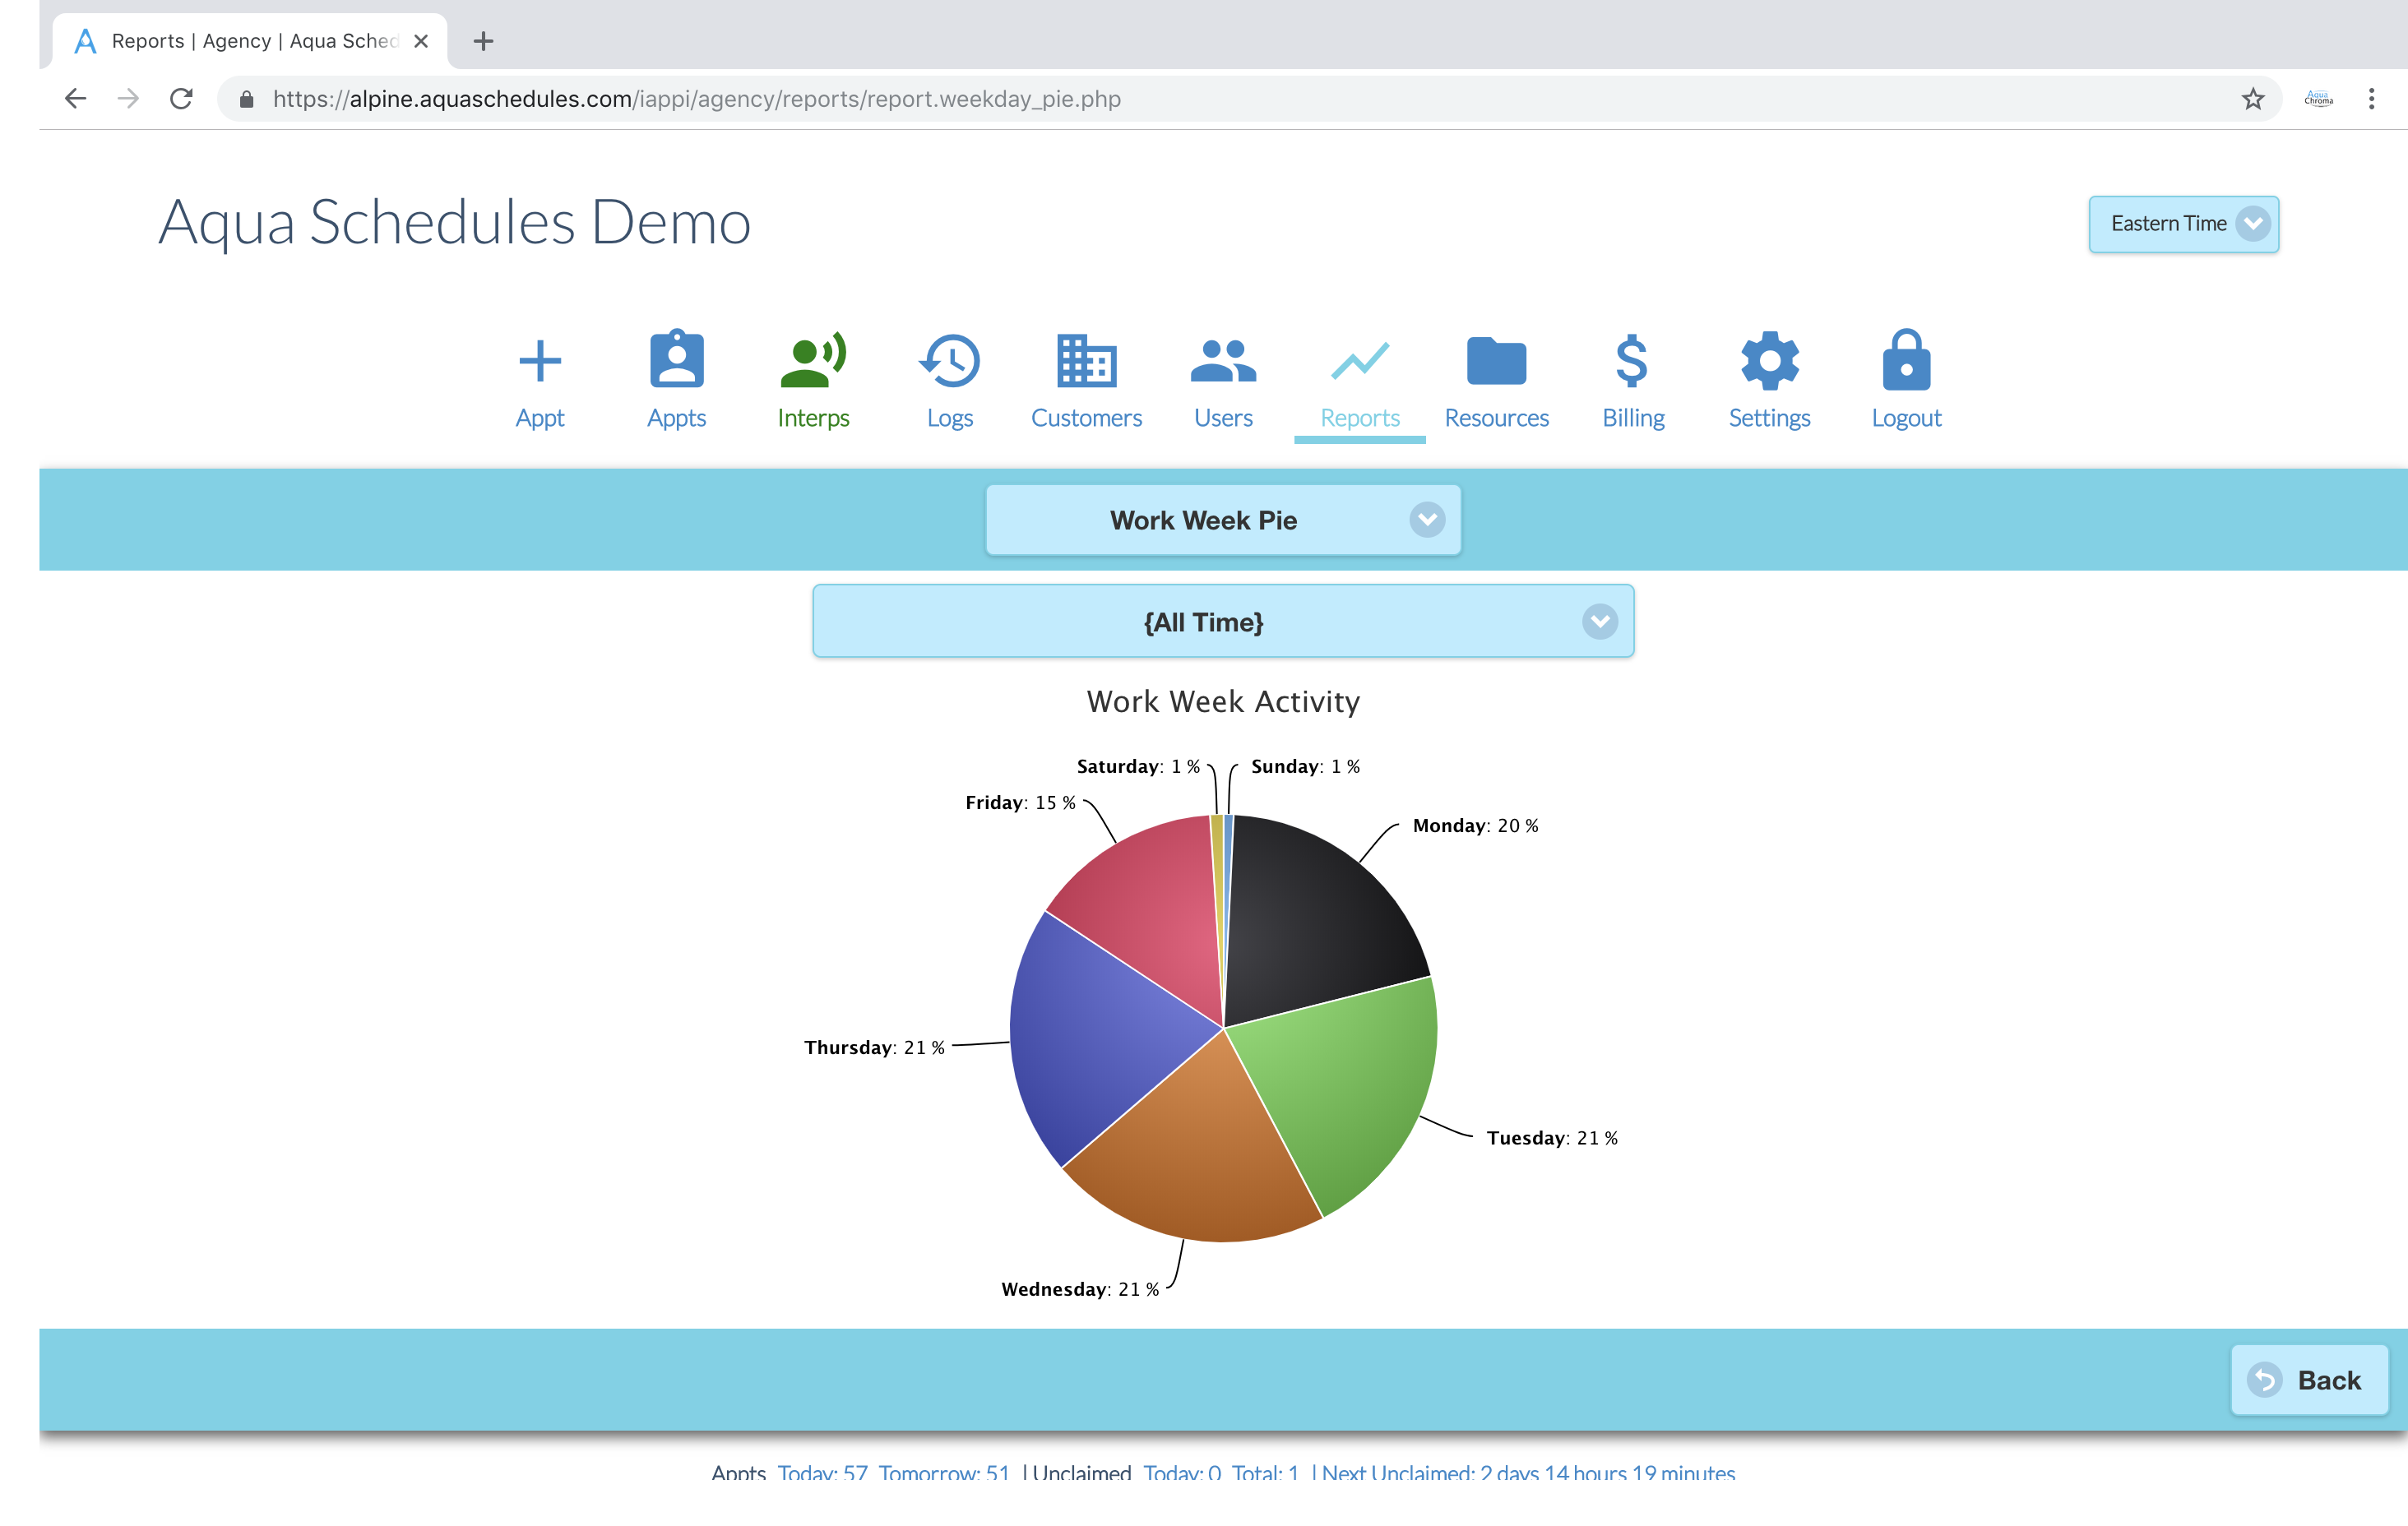
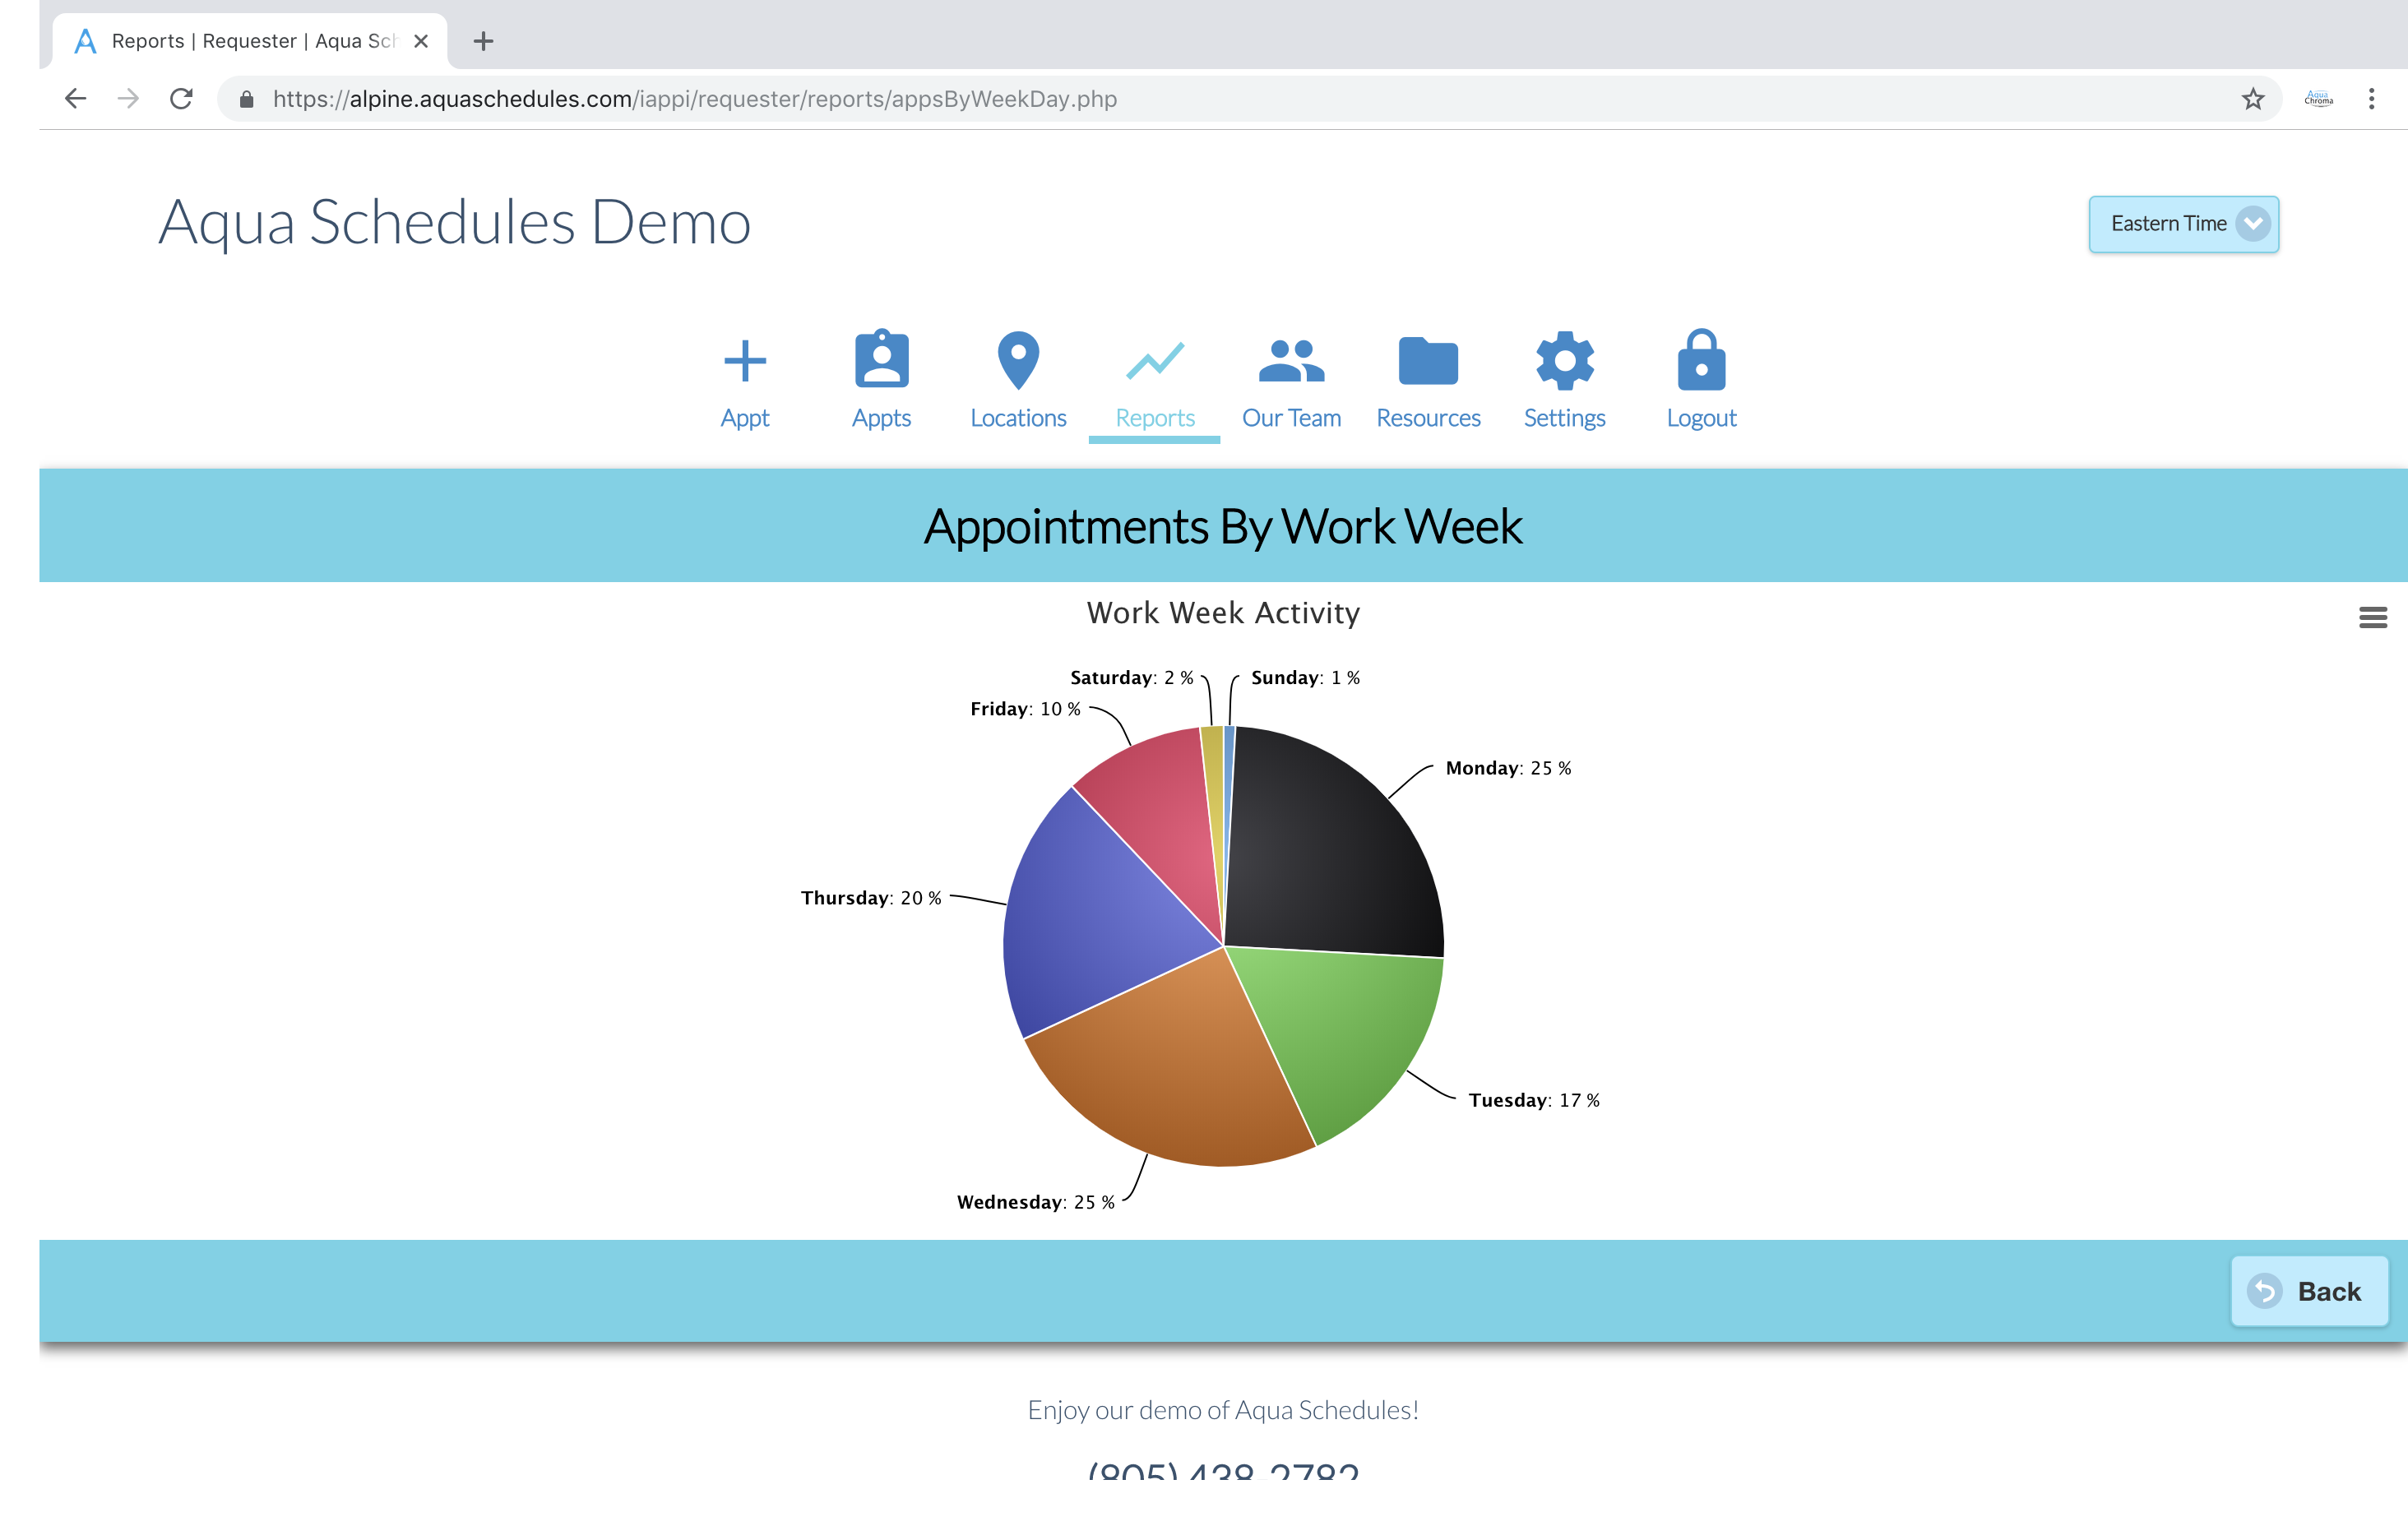
Pie chart showing the overall distribution of appointments over the 7 week days.
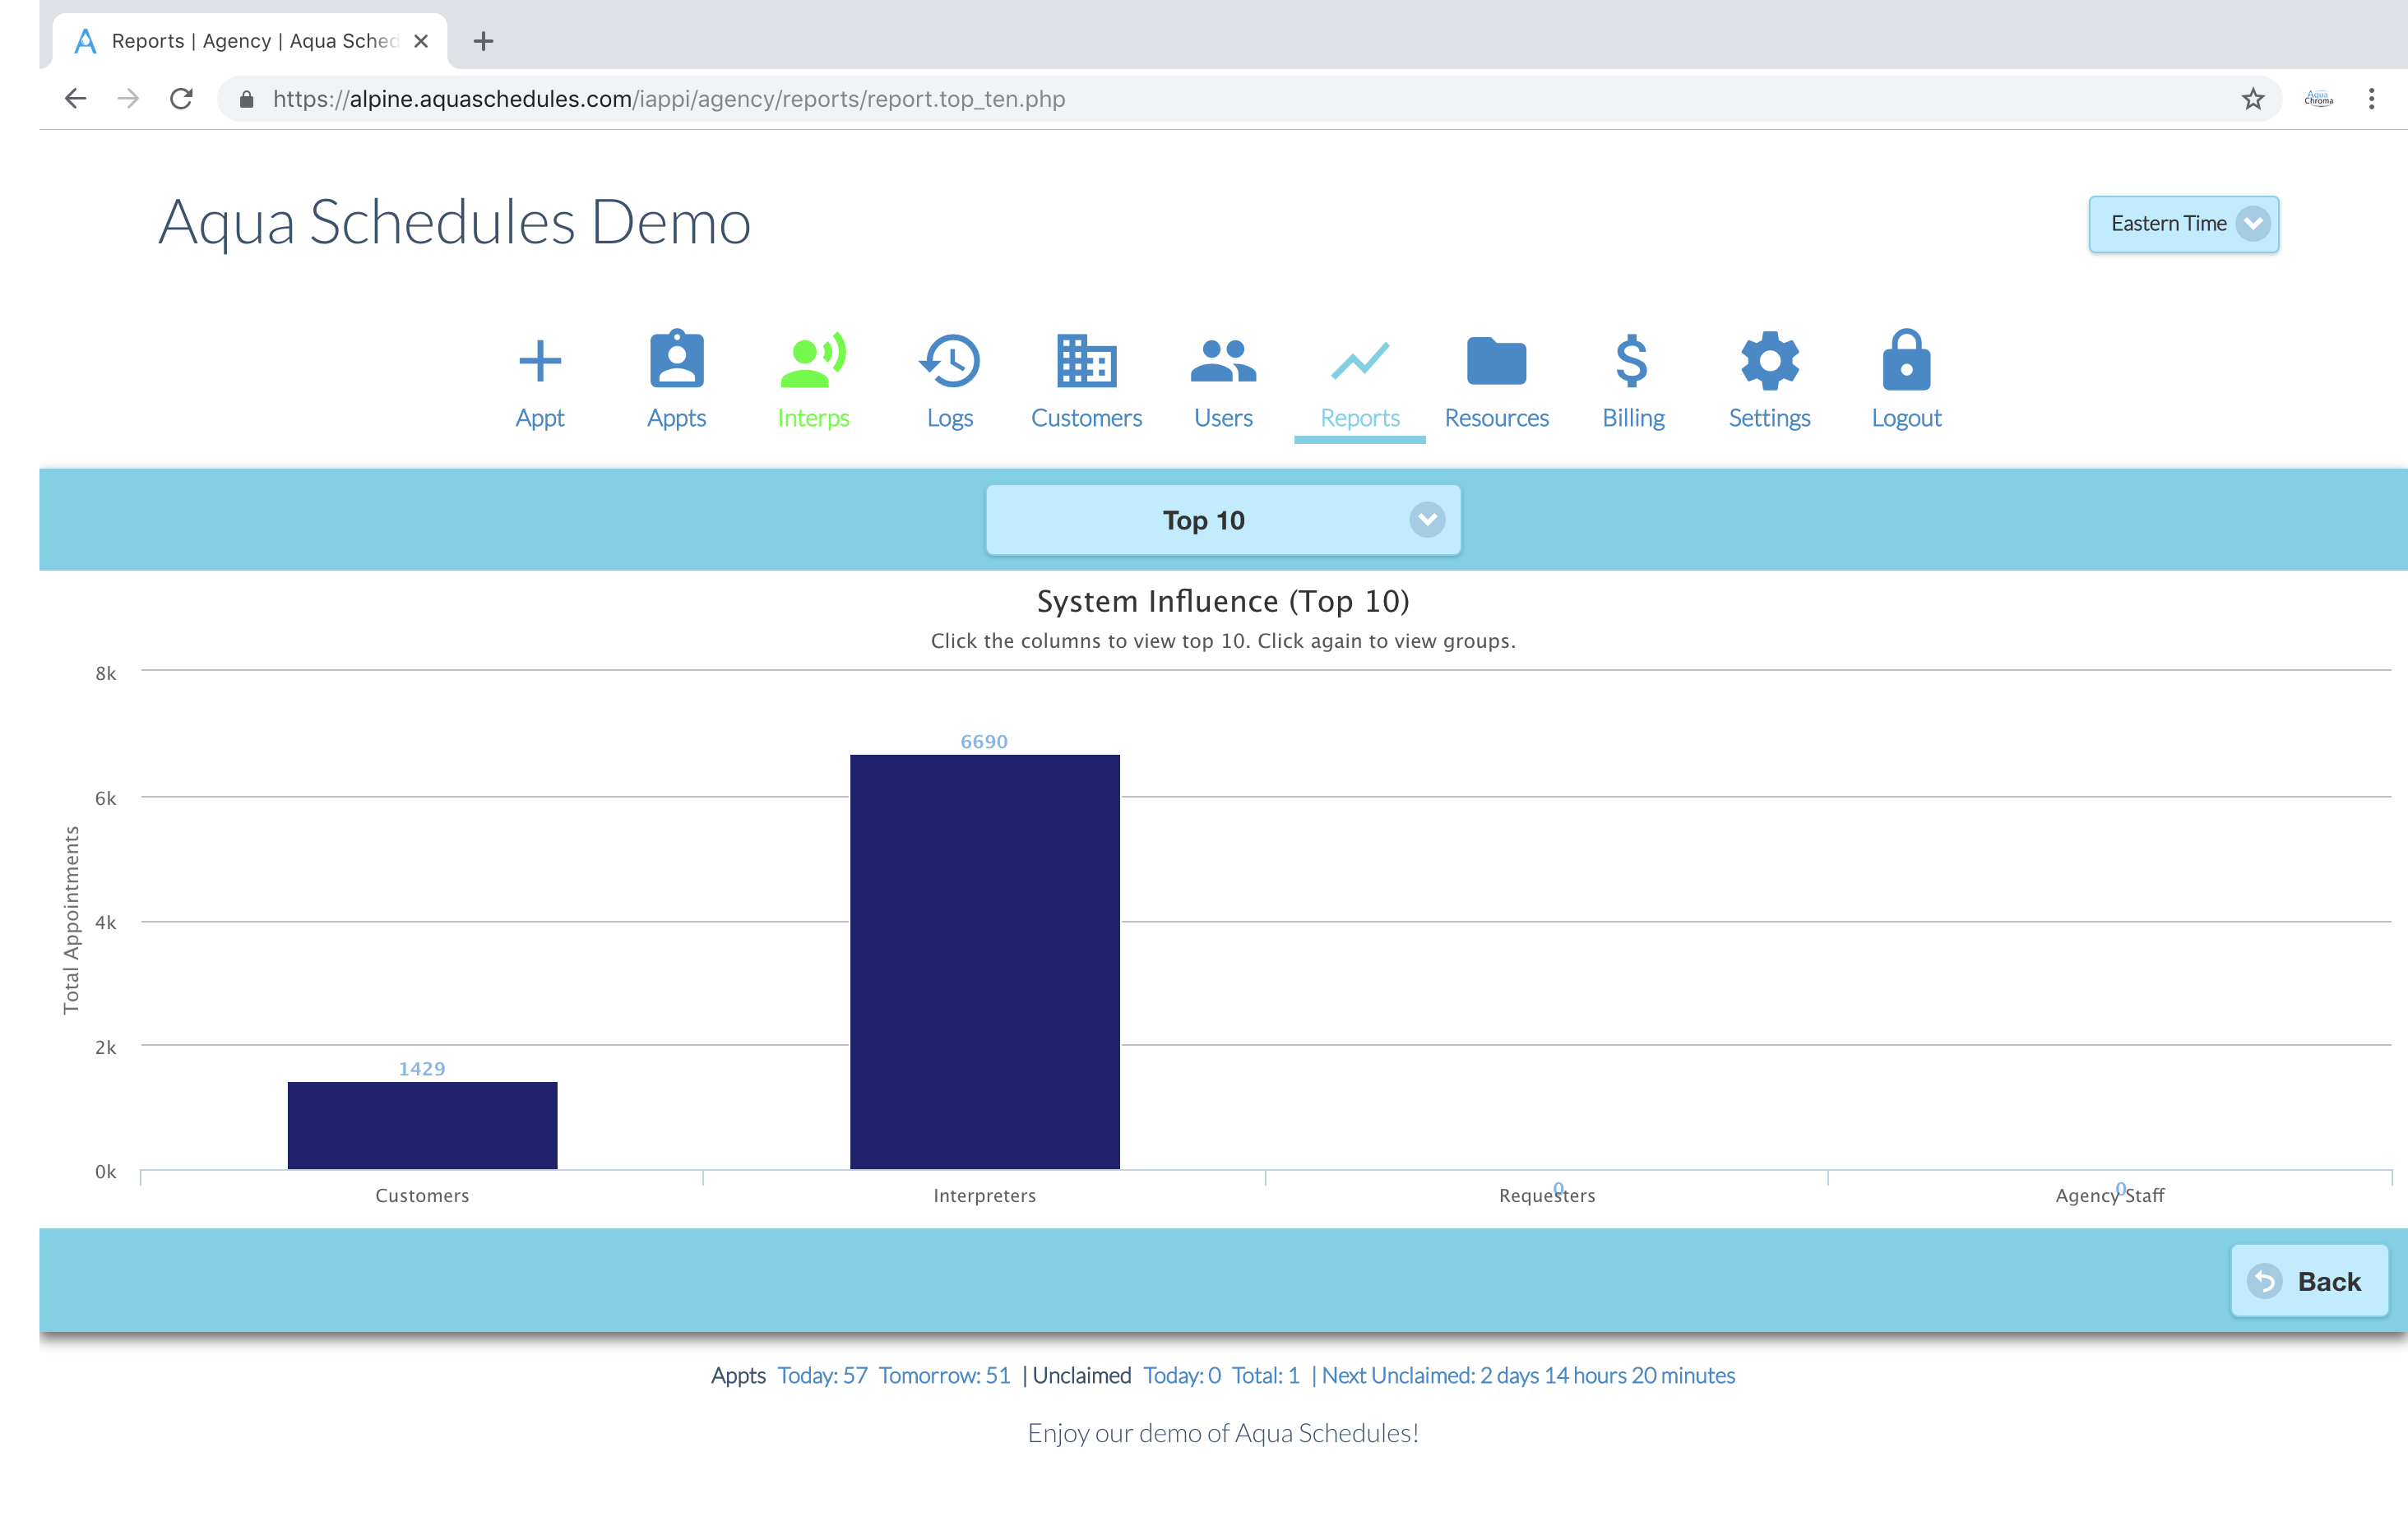
Bar graph showing the quantity of appointments worked by interpreter.
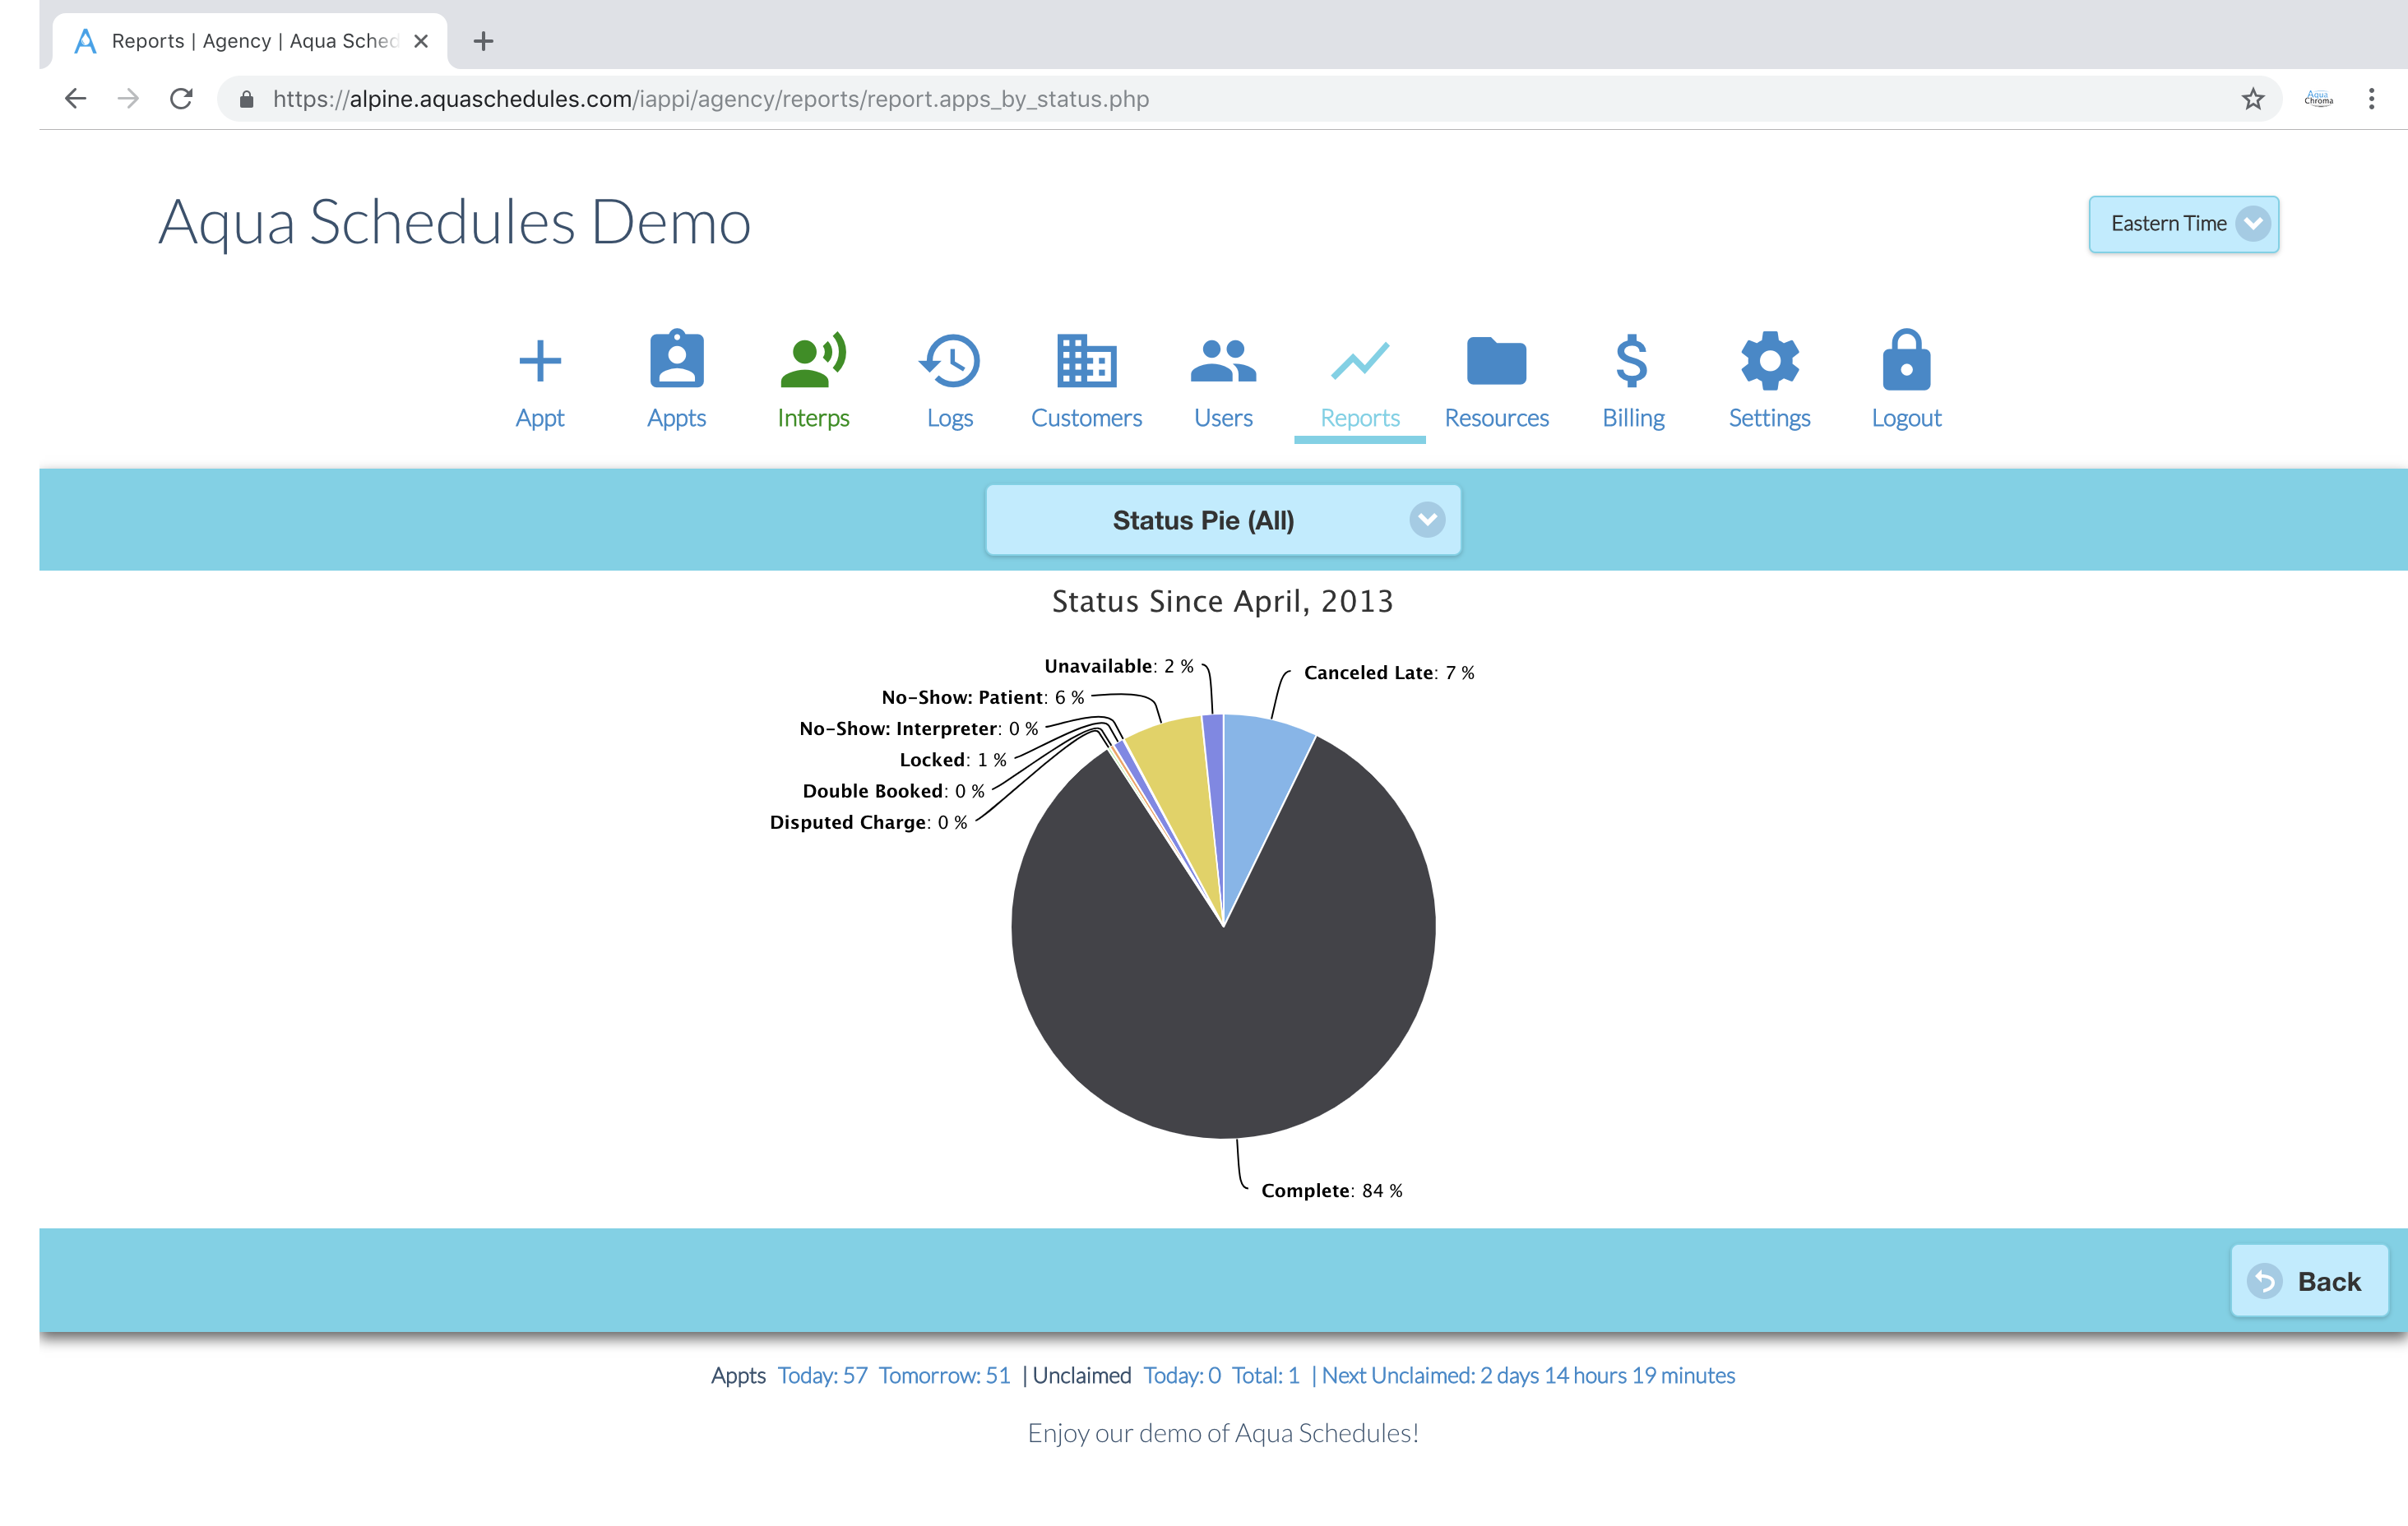
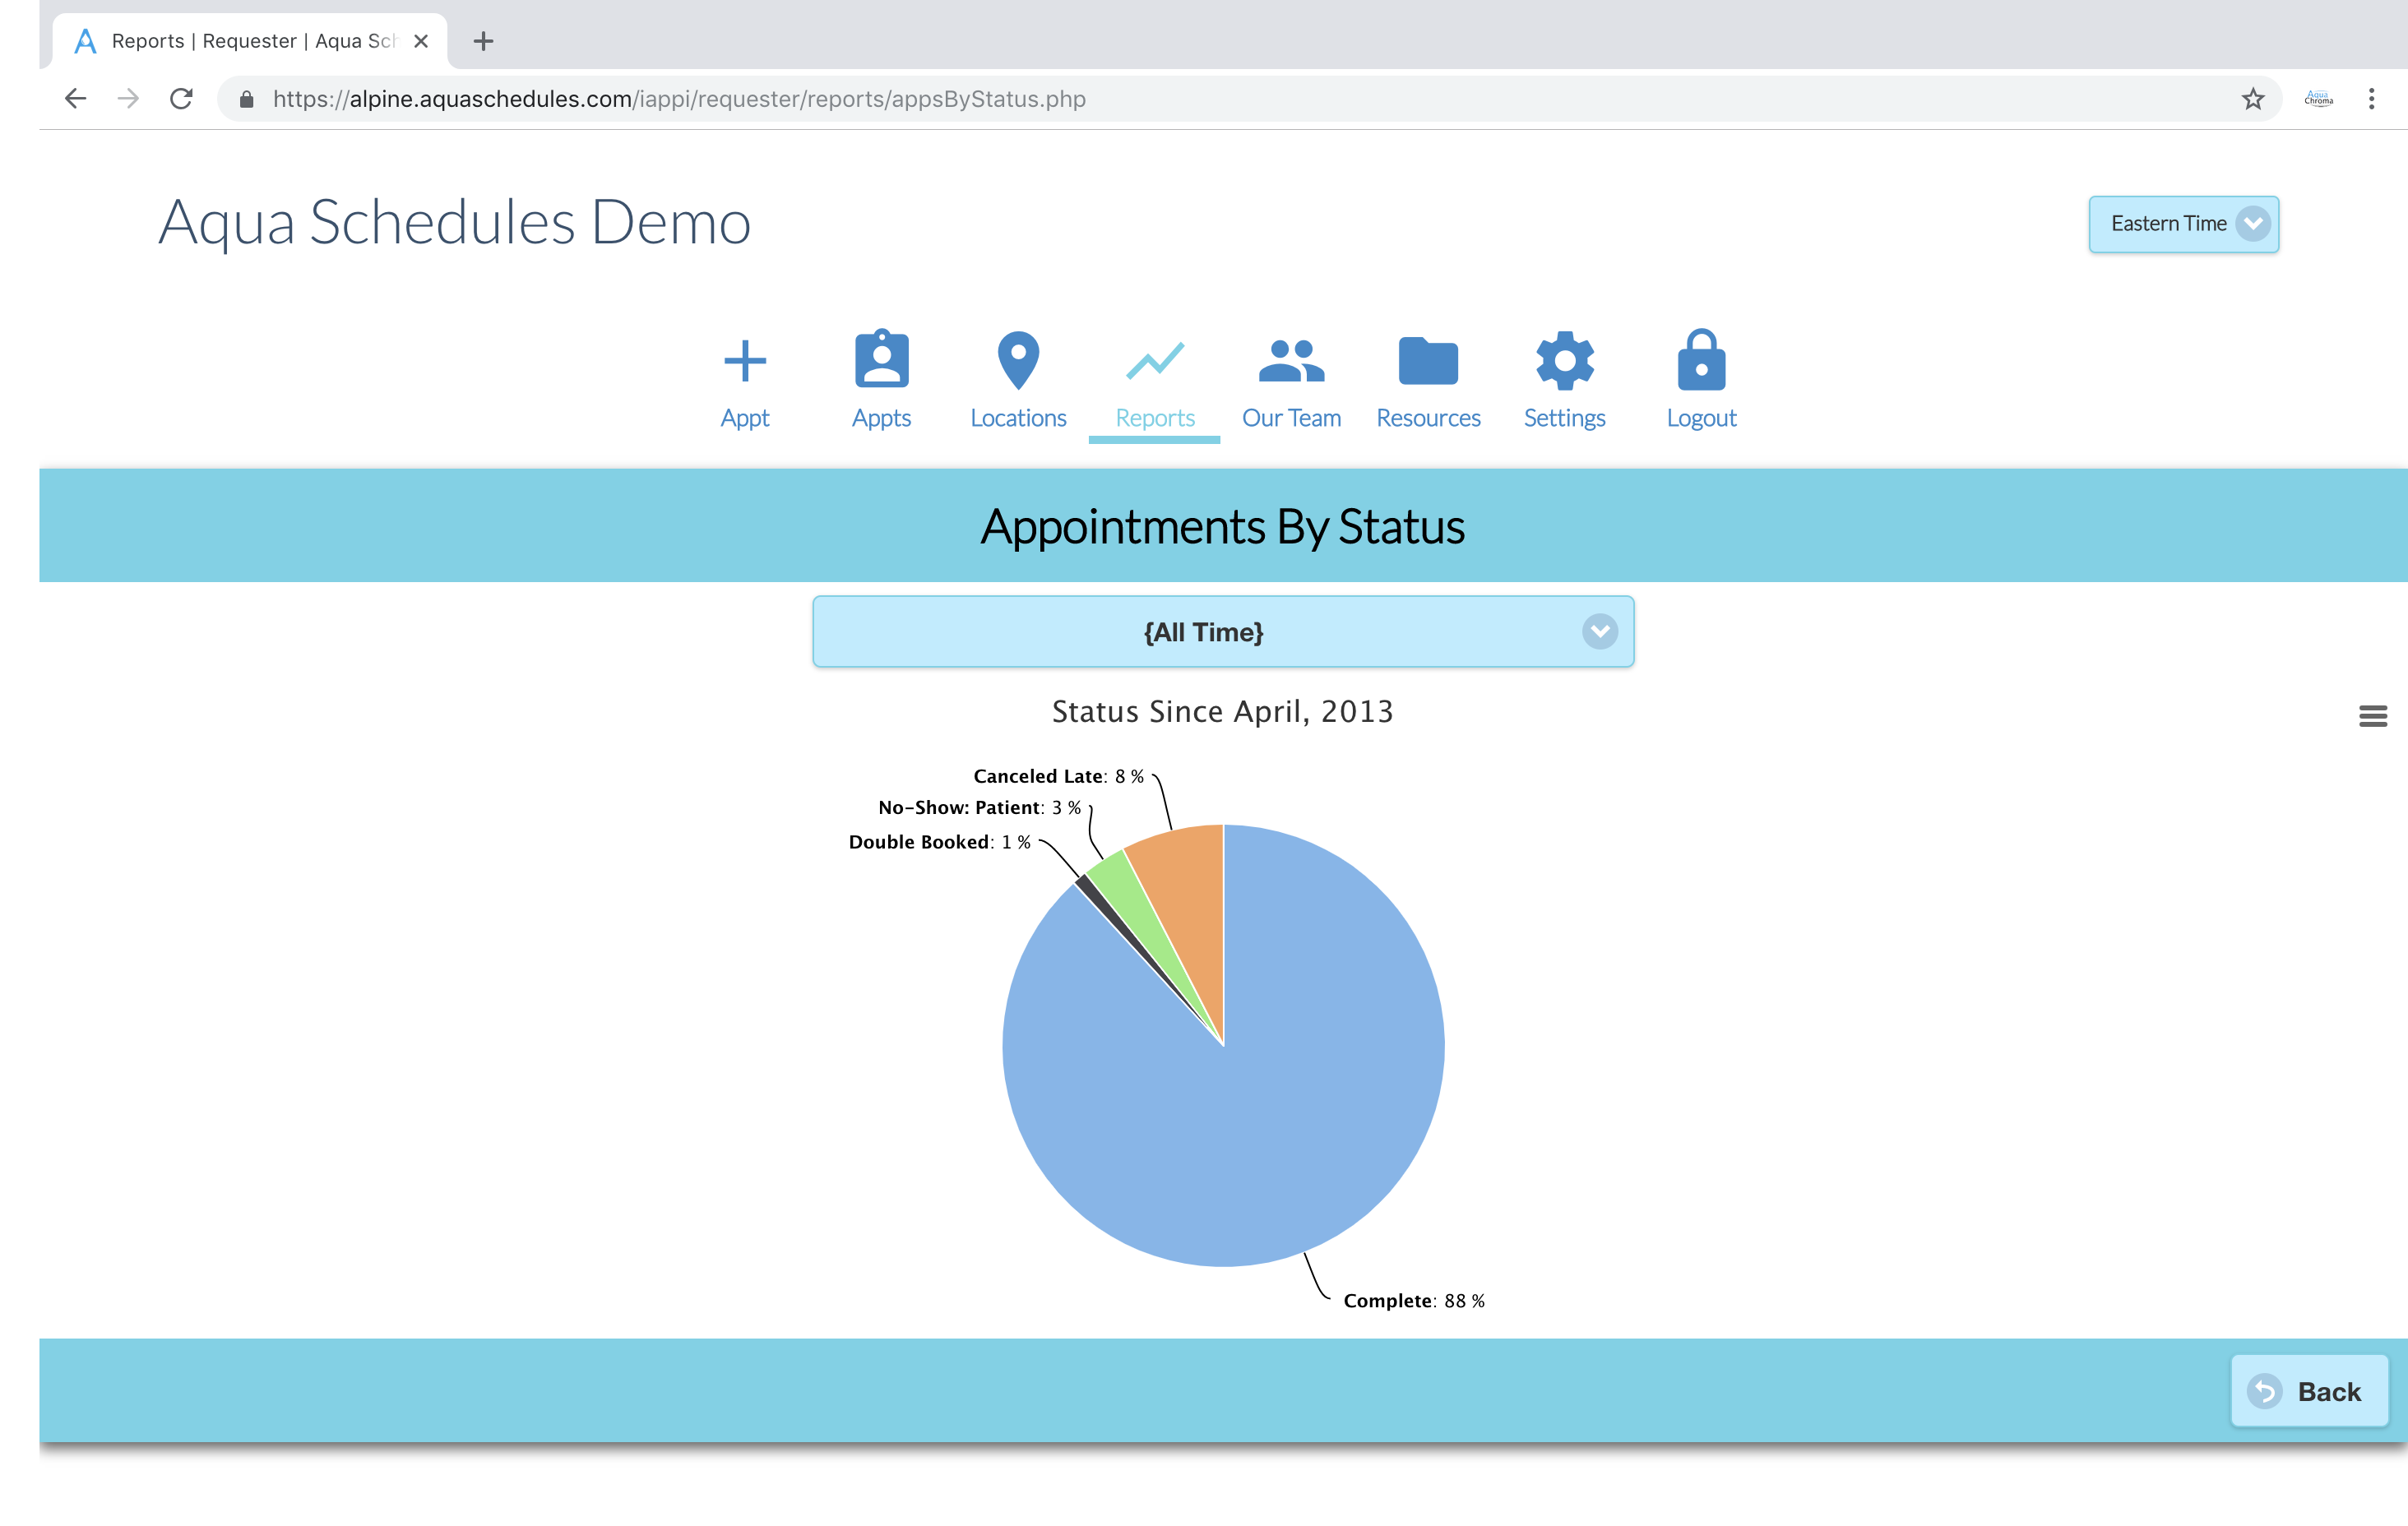
Pie chart showing the overall distribution of appointments status.
1 (805) GET-AQUA | 1.805.438.2782
Aqua Schedules. All Rights Reserved. Marking Site Designed by HTML Codex